Fourth round predictions for Super Netball.
To refresh your memory, here’s a description of how my model works.
Predictions for the fourth round are given in the table below. The priors for these distributions are based on the final abilities from last season and the results from rounds 1–4. However, given the Super Shot, it’ll take a little while for the model to adapt to the adjusted goals.
| Home | Away | Chance of home team winning |
|---|---|---|
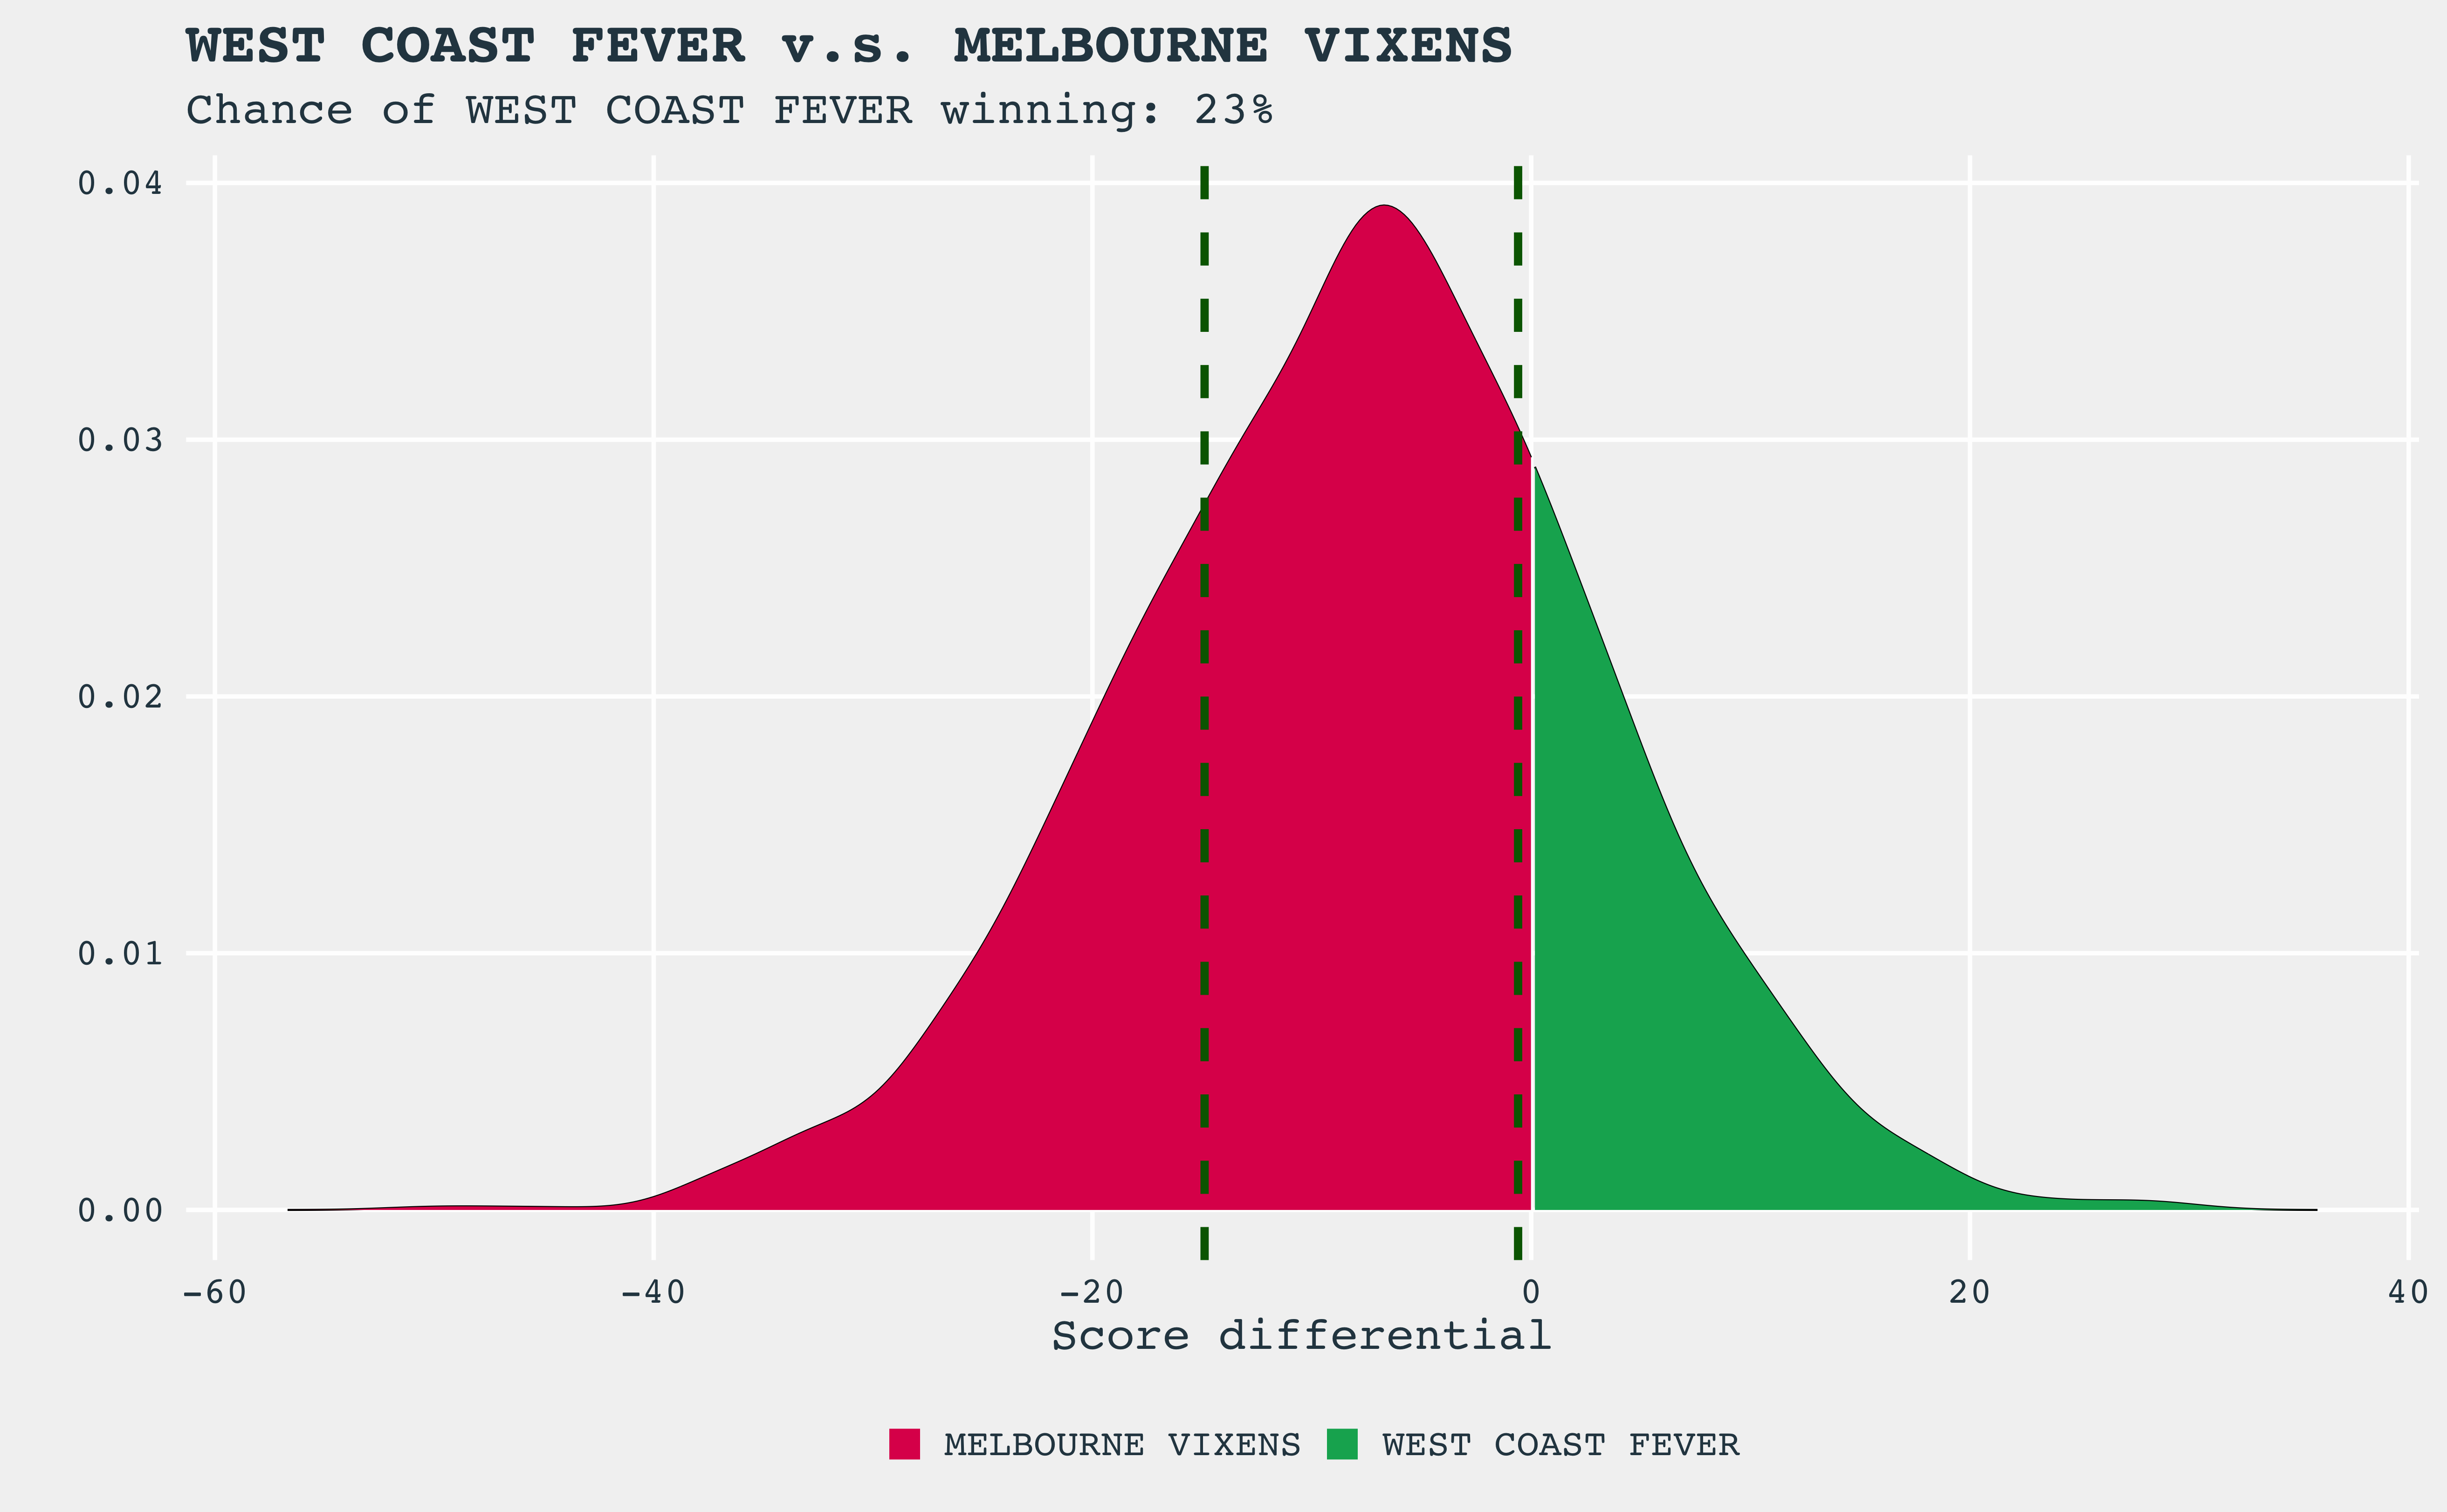
| West Coast Fever | Melbourne Vixens | 23% |
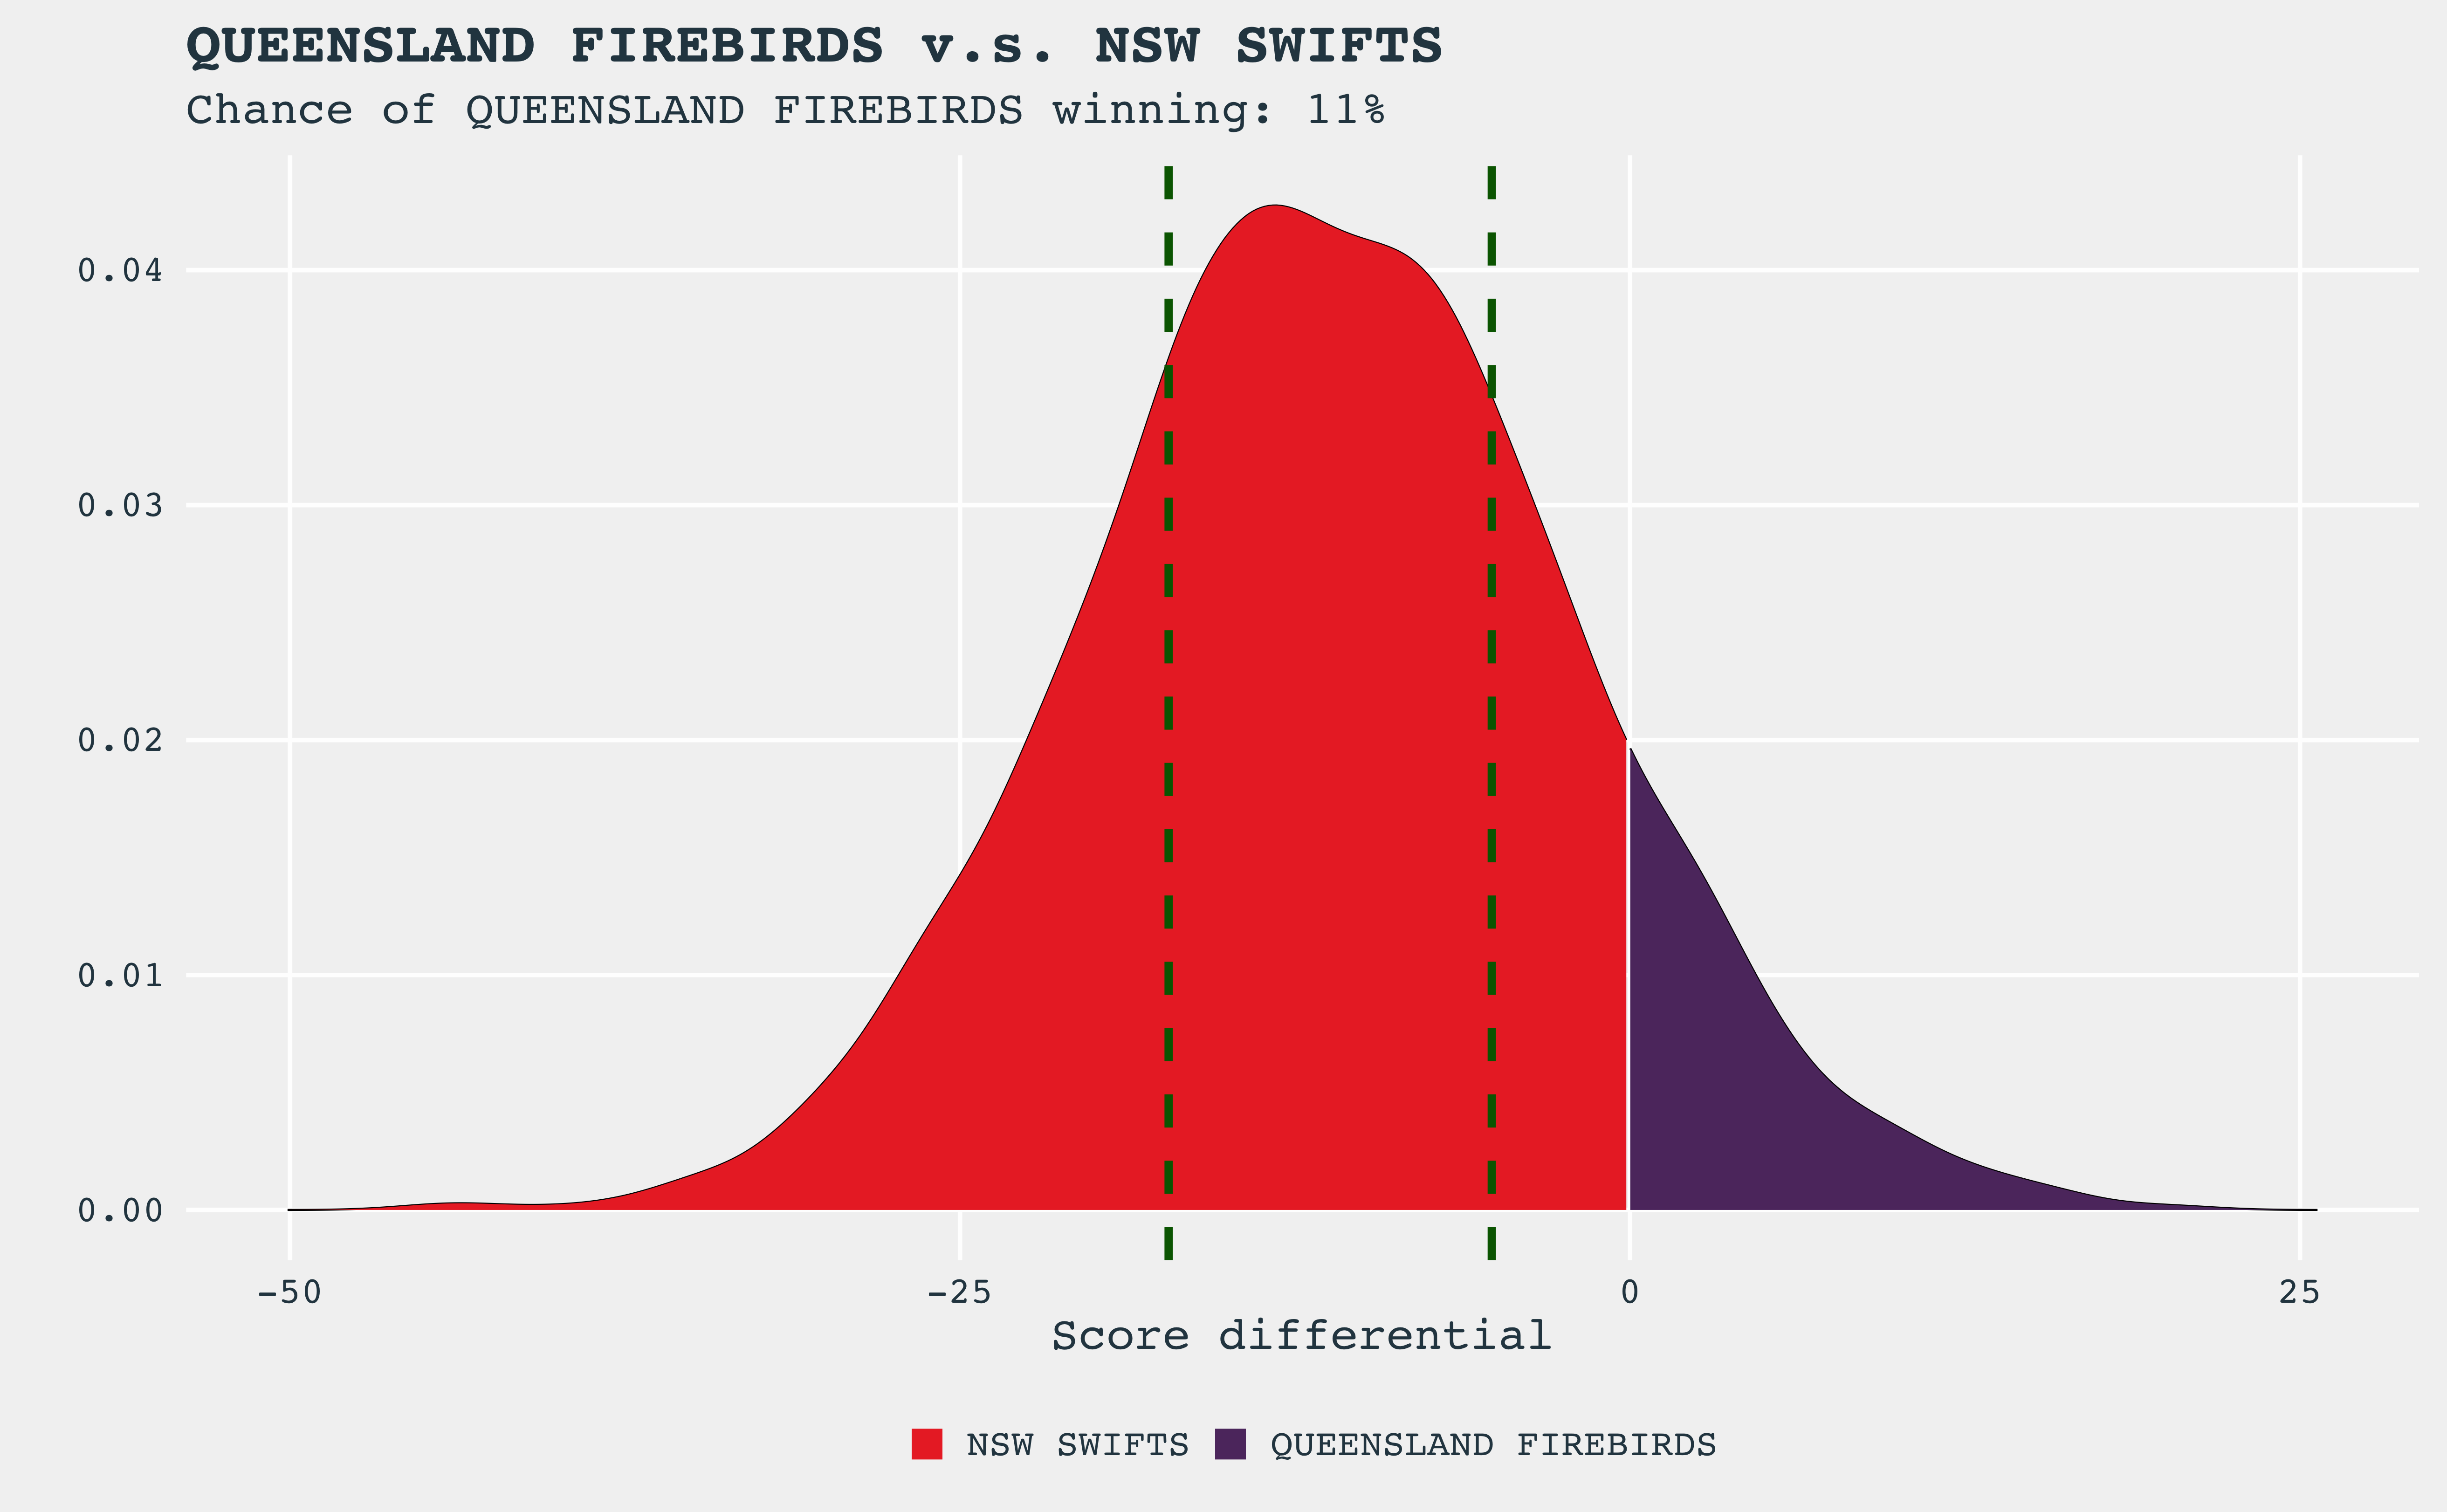
| Queensland Firebirds | NSW Swifts | 11% |
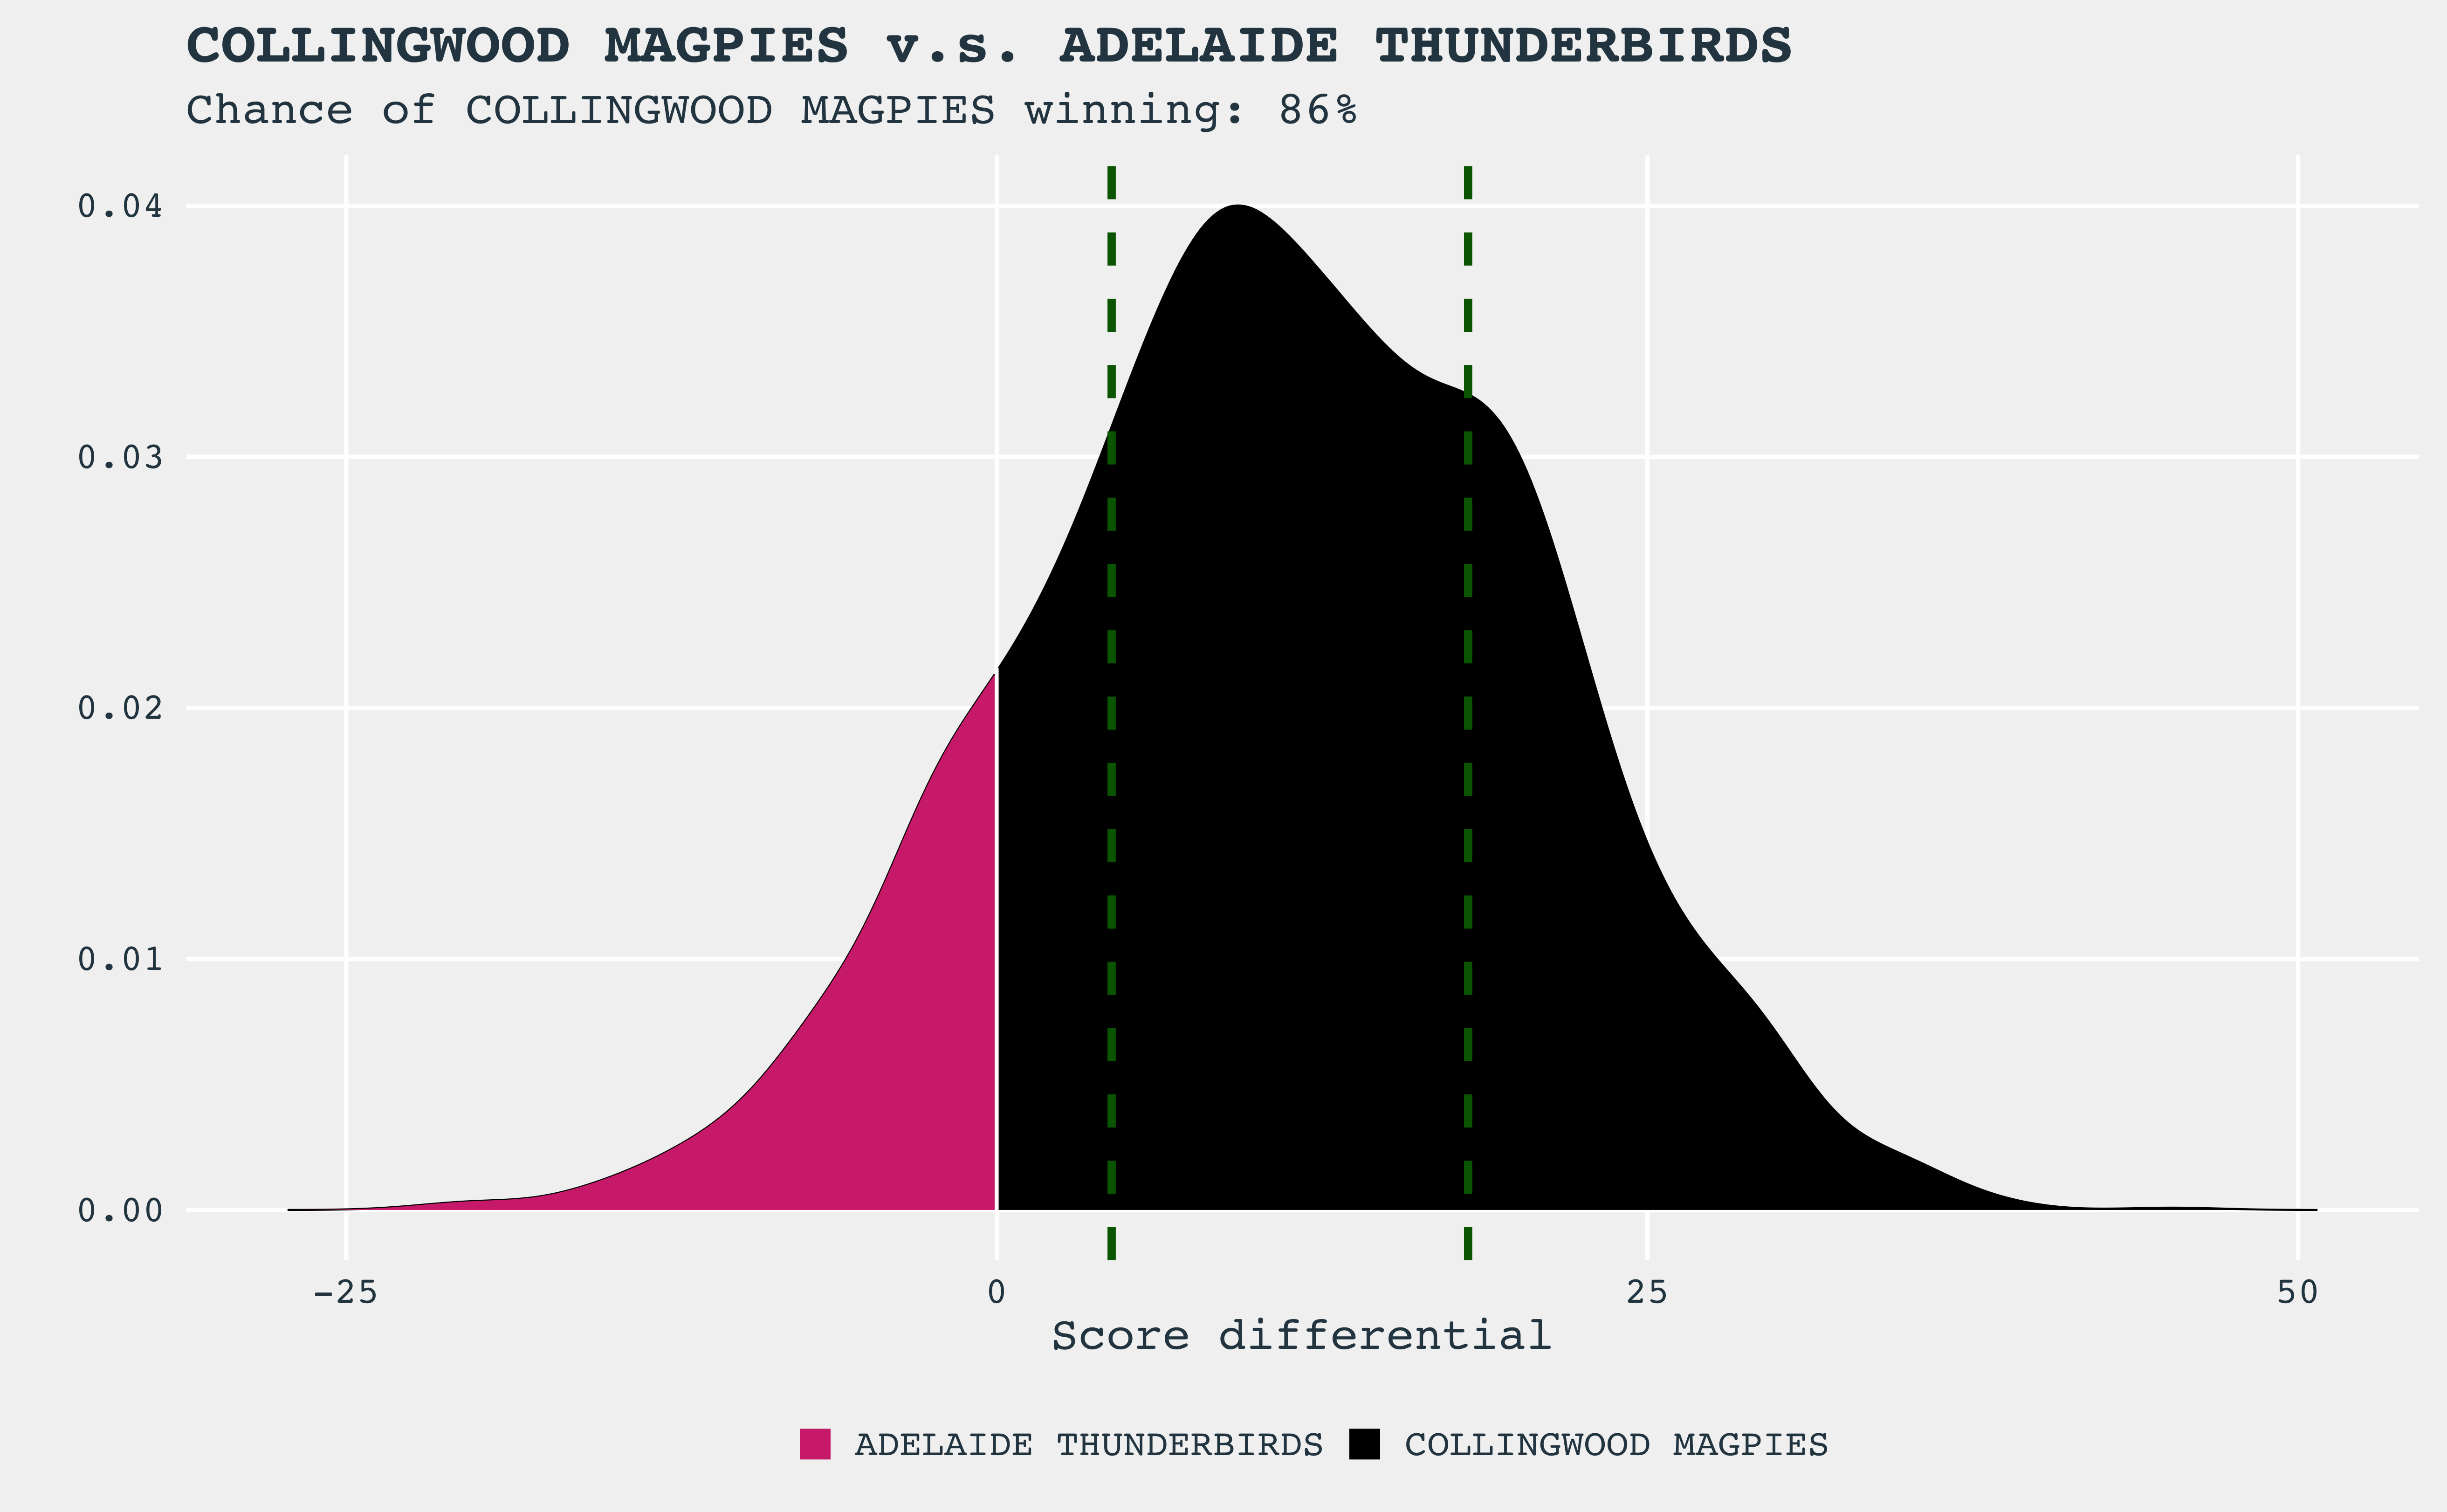
| Collingwood Magpies | Adelaide Thunderbirds | 86% |
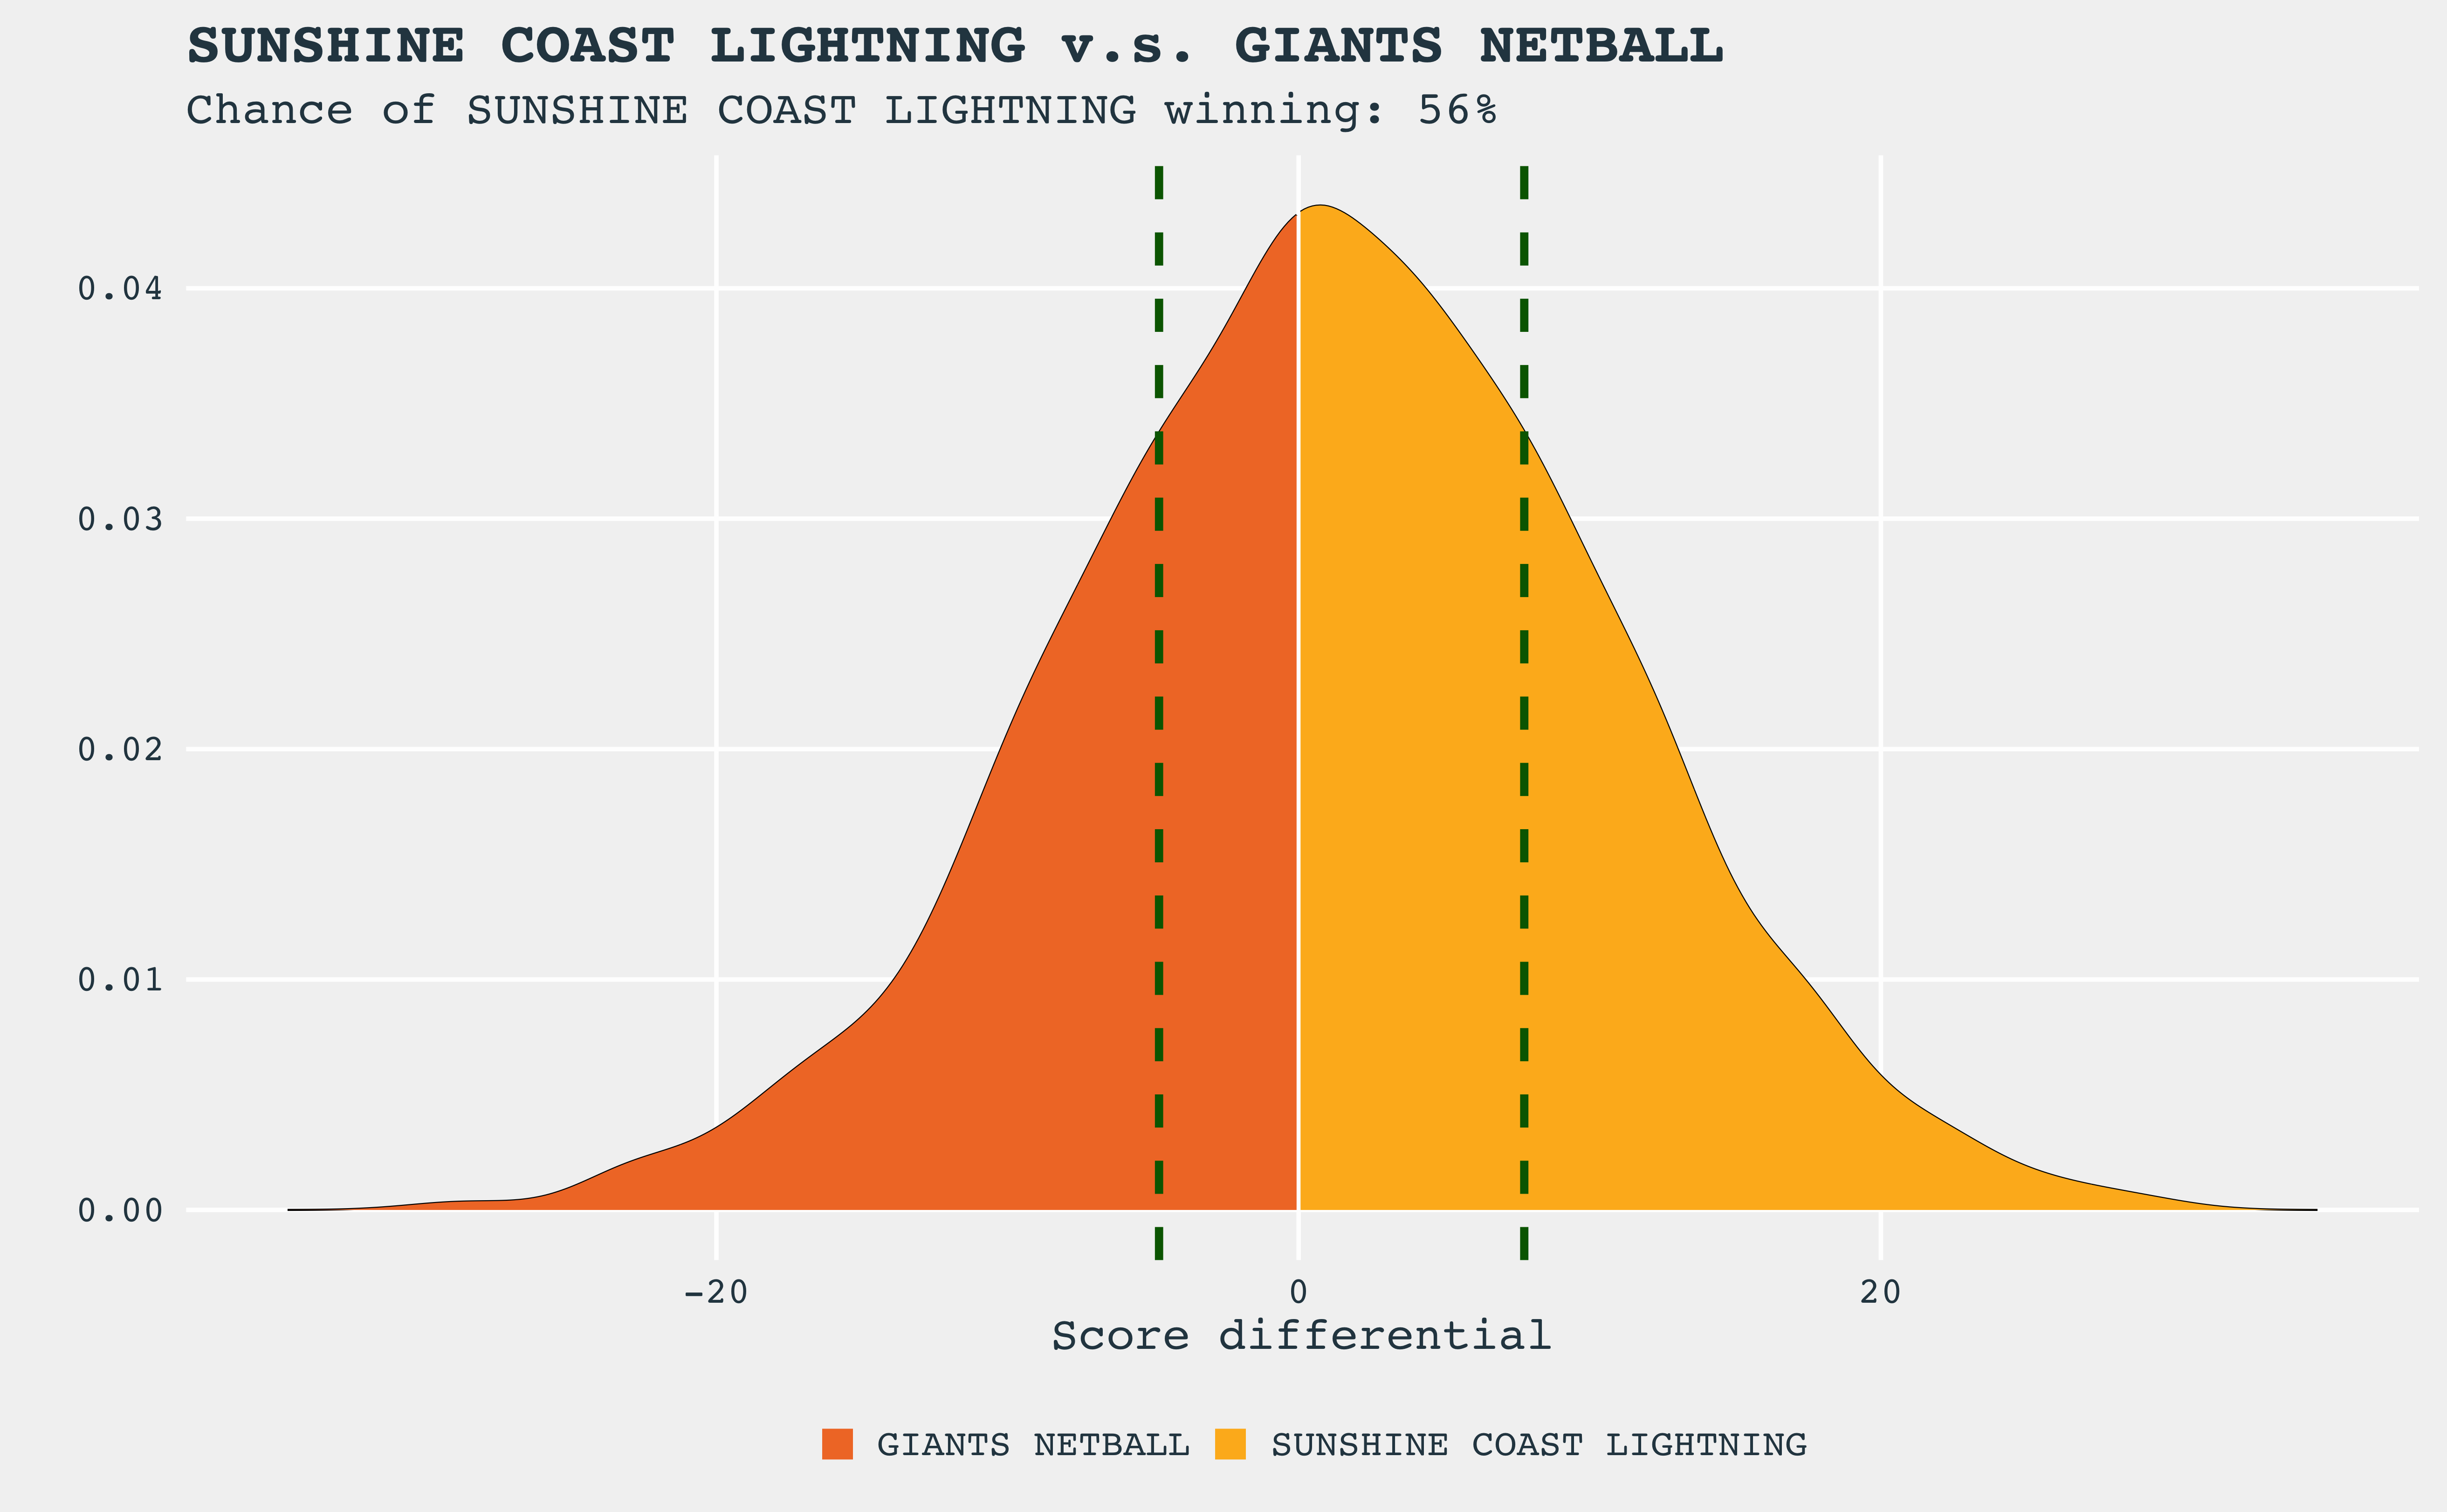
| Sunshine Coast Lightning | GIANTS Netball | 56% |
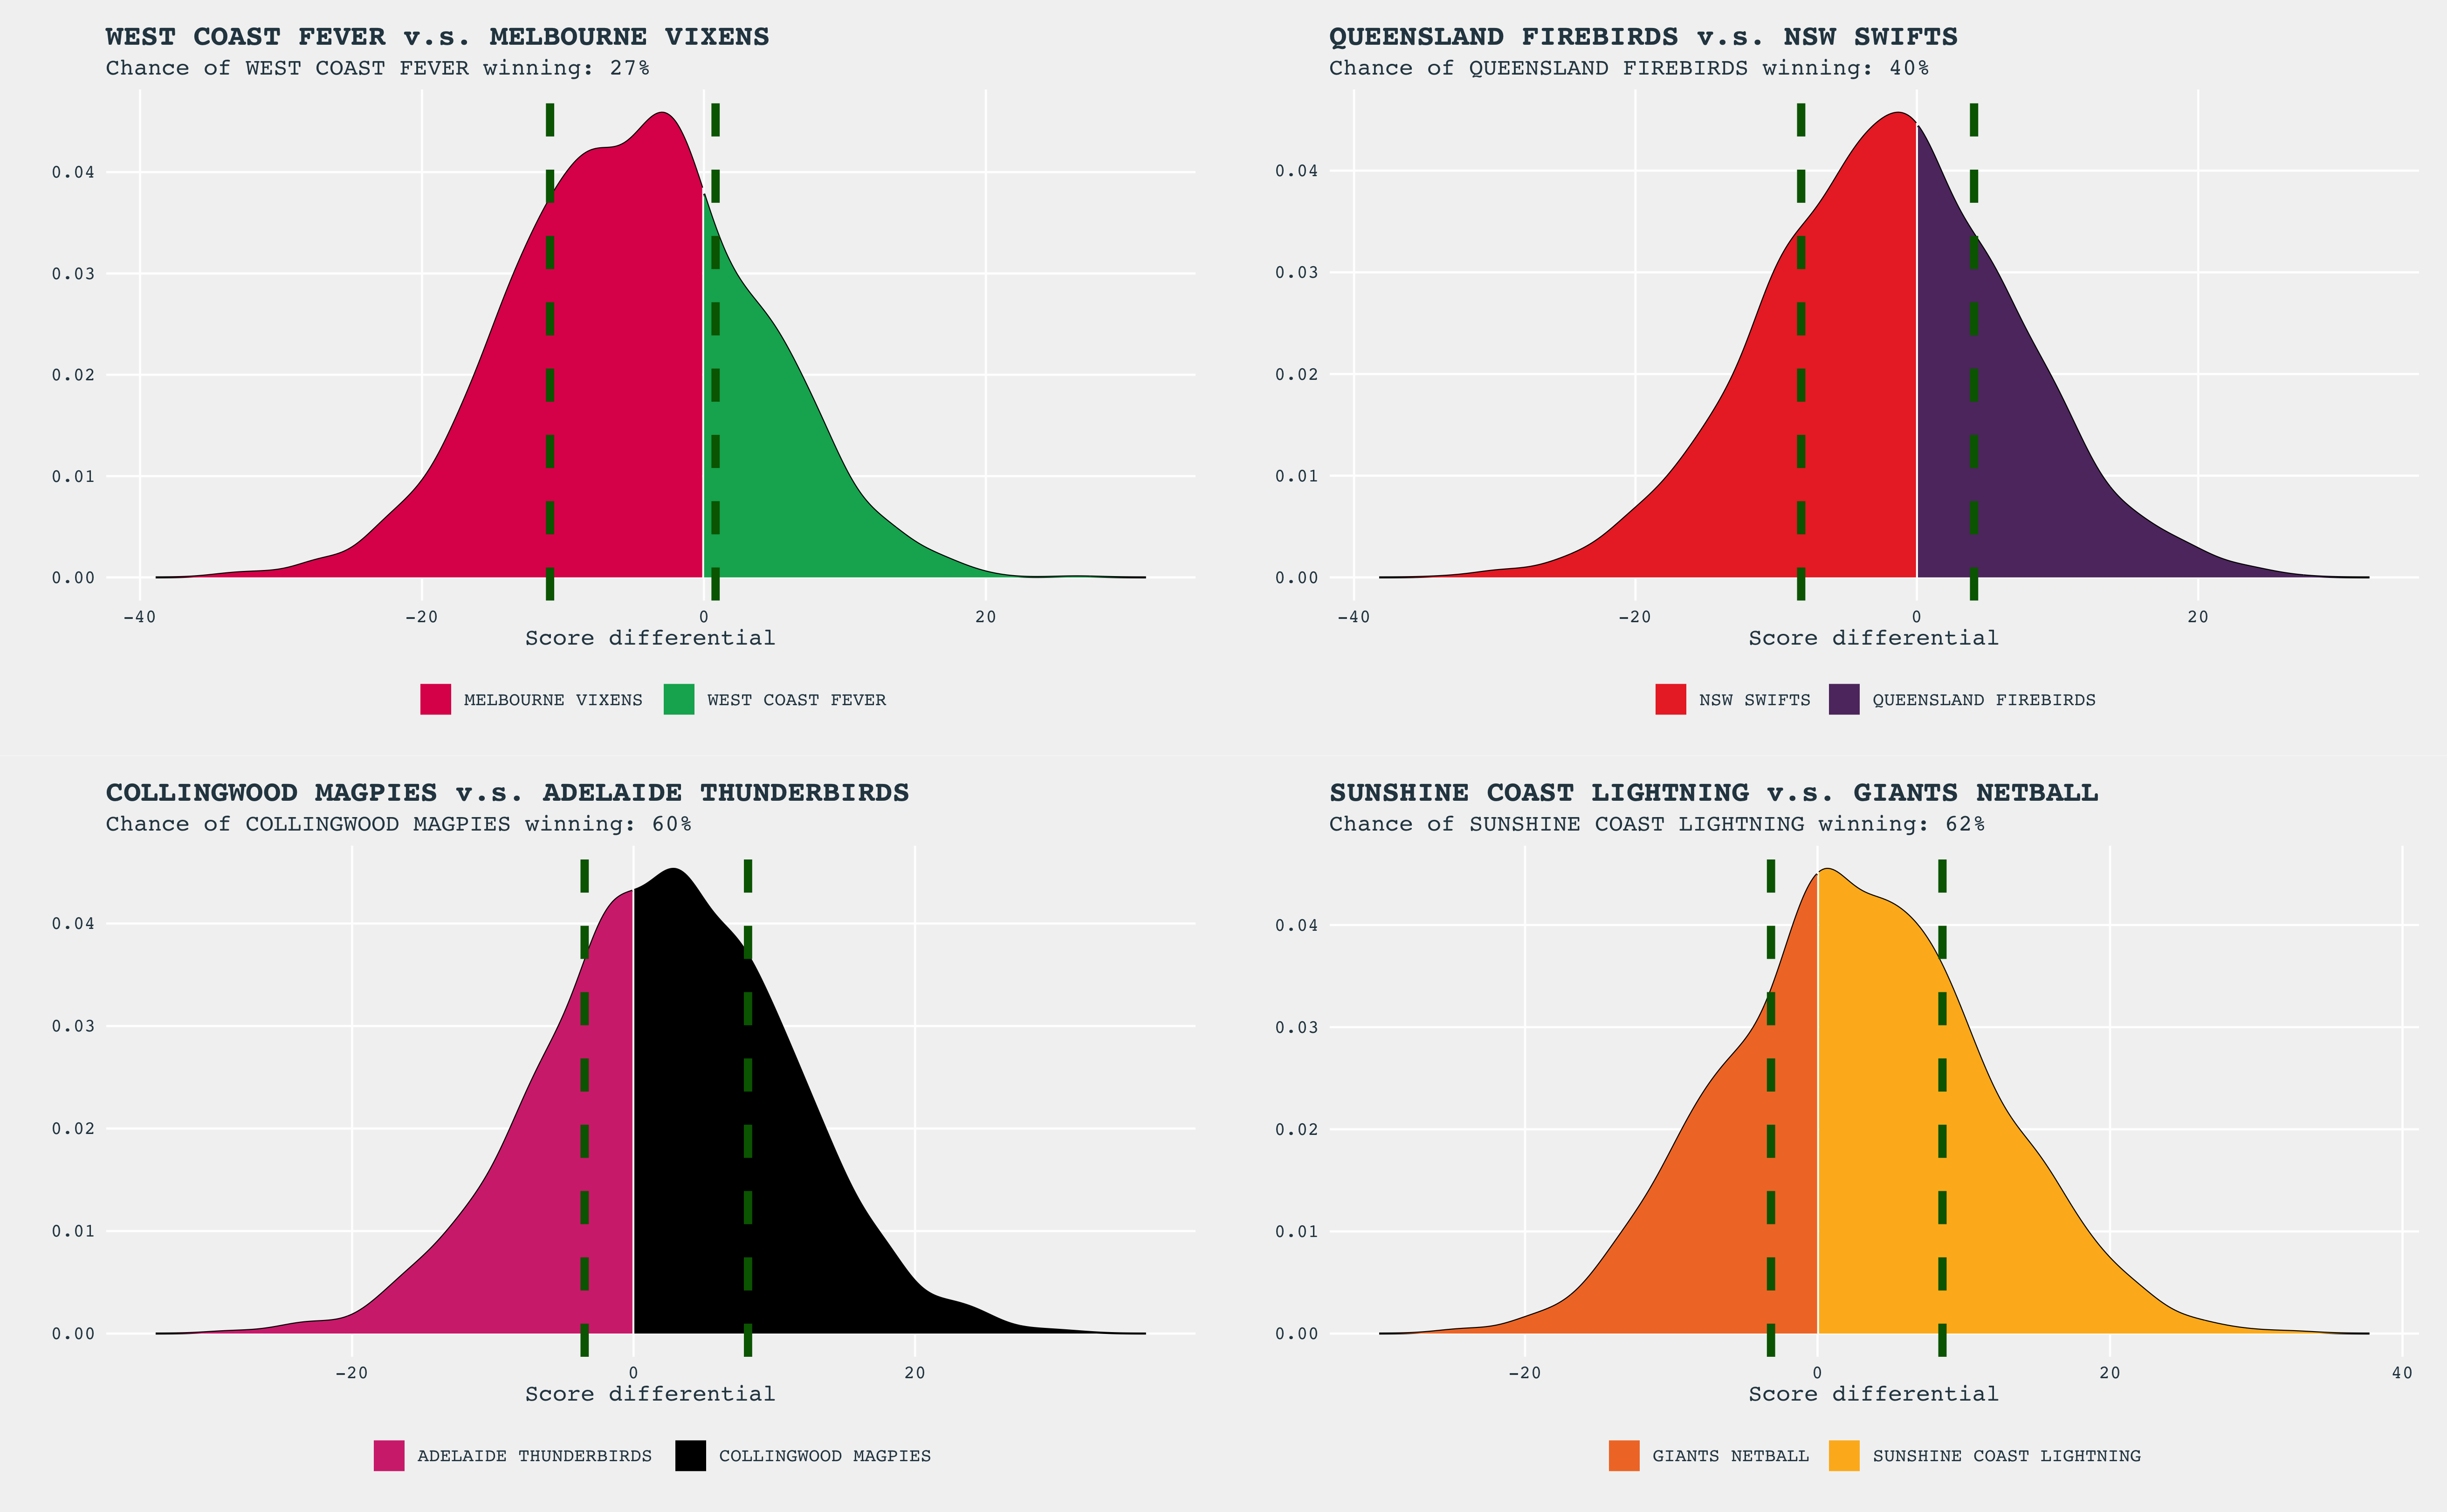
Score Differential Distributions
The distribution of the predicted score differentials is shown in the figures below. For each game, the chance of the home team winning is calculated and shown in the figure title. Each distribution is coloured by the team’s colours, and the more of a single team’s colour, the higher the chance that team has of winning. Overlaid on each figure are two vertical, dashed dark green lines; these show the score differential that has a 50% predicted chance of happening.
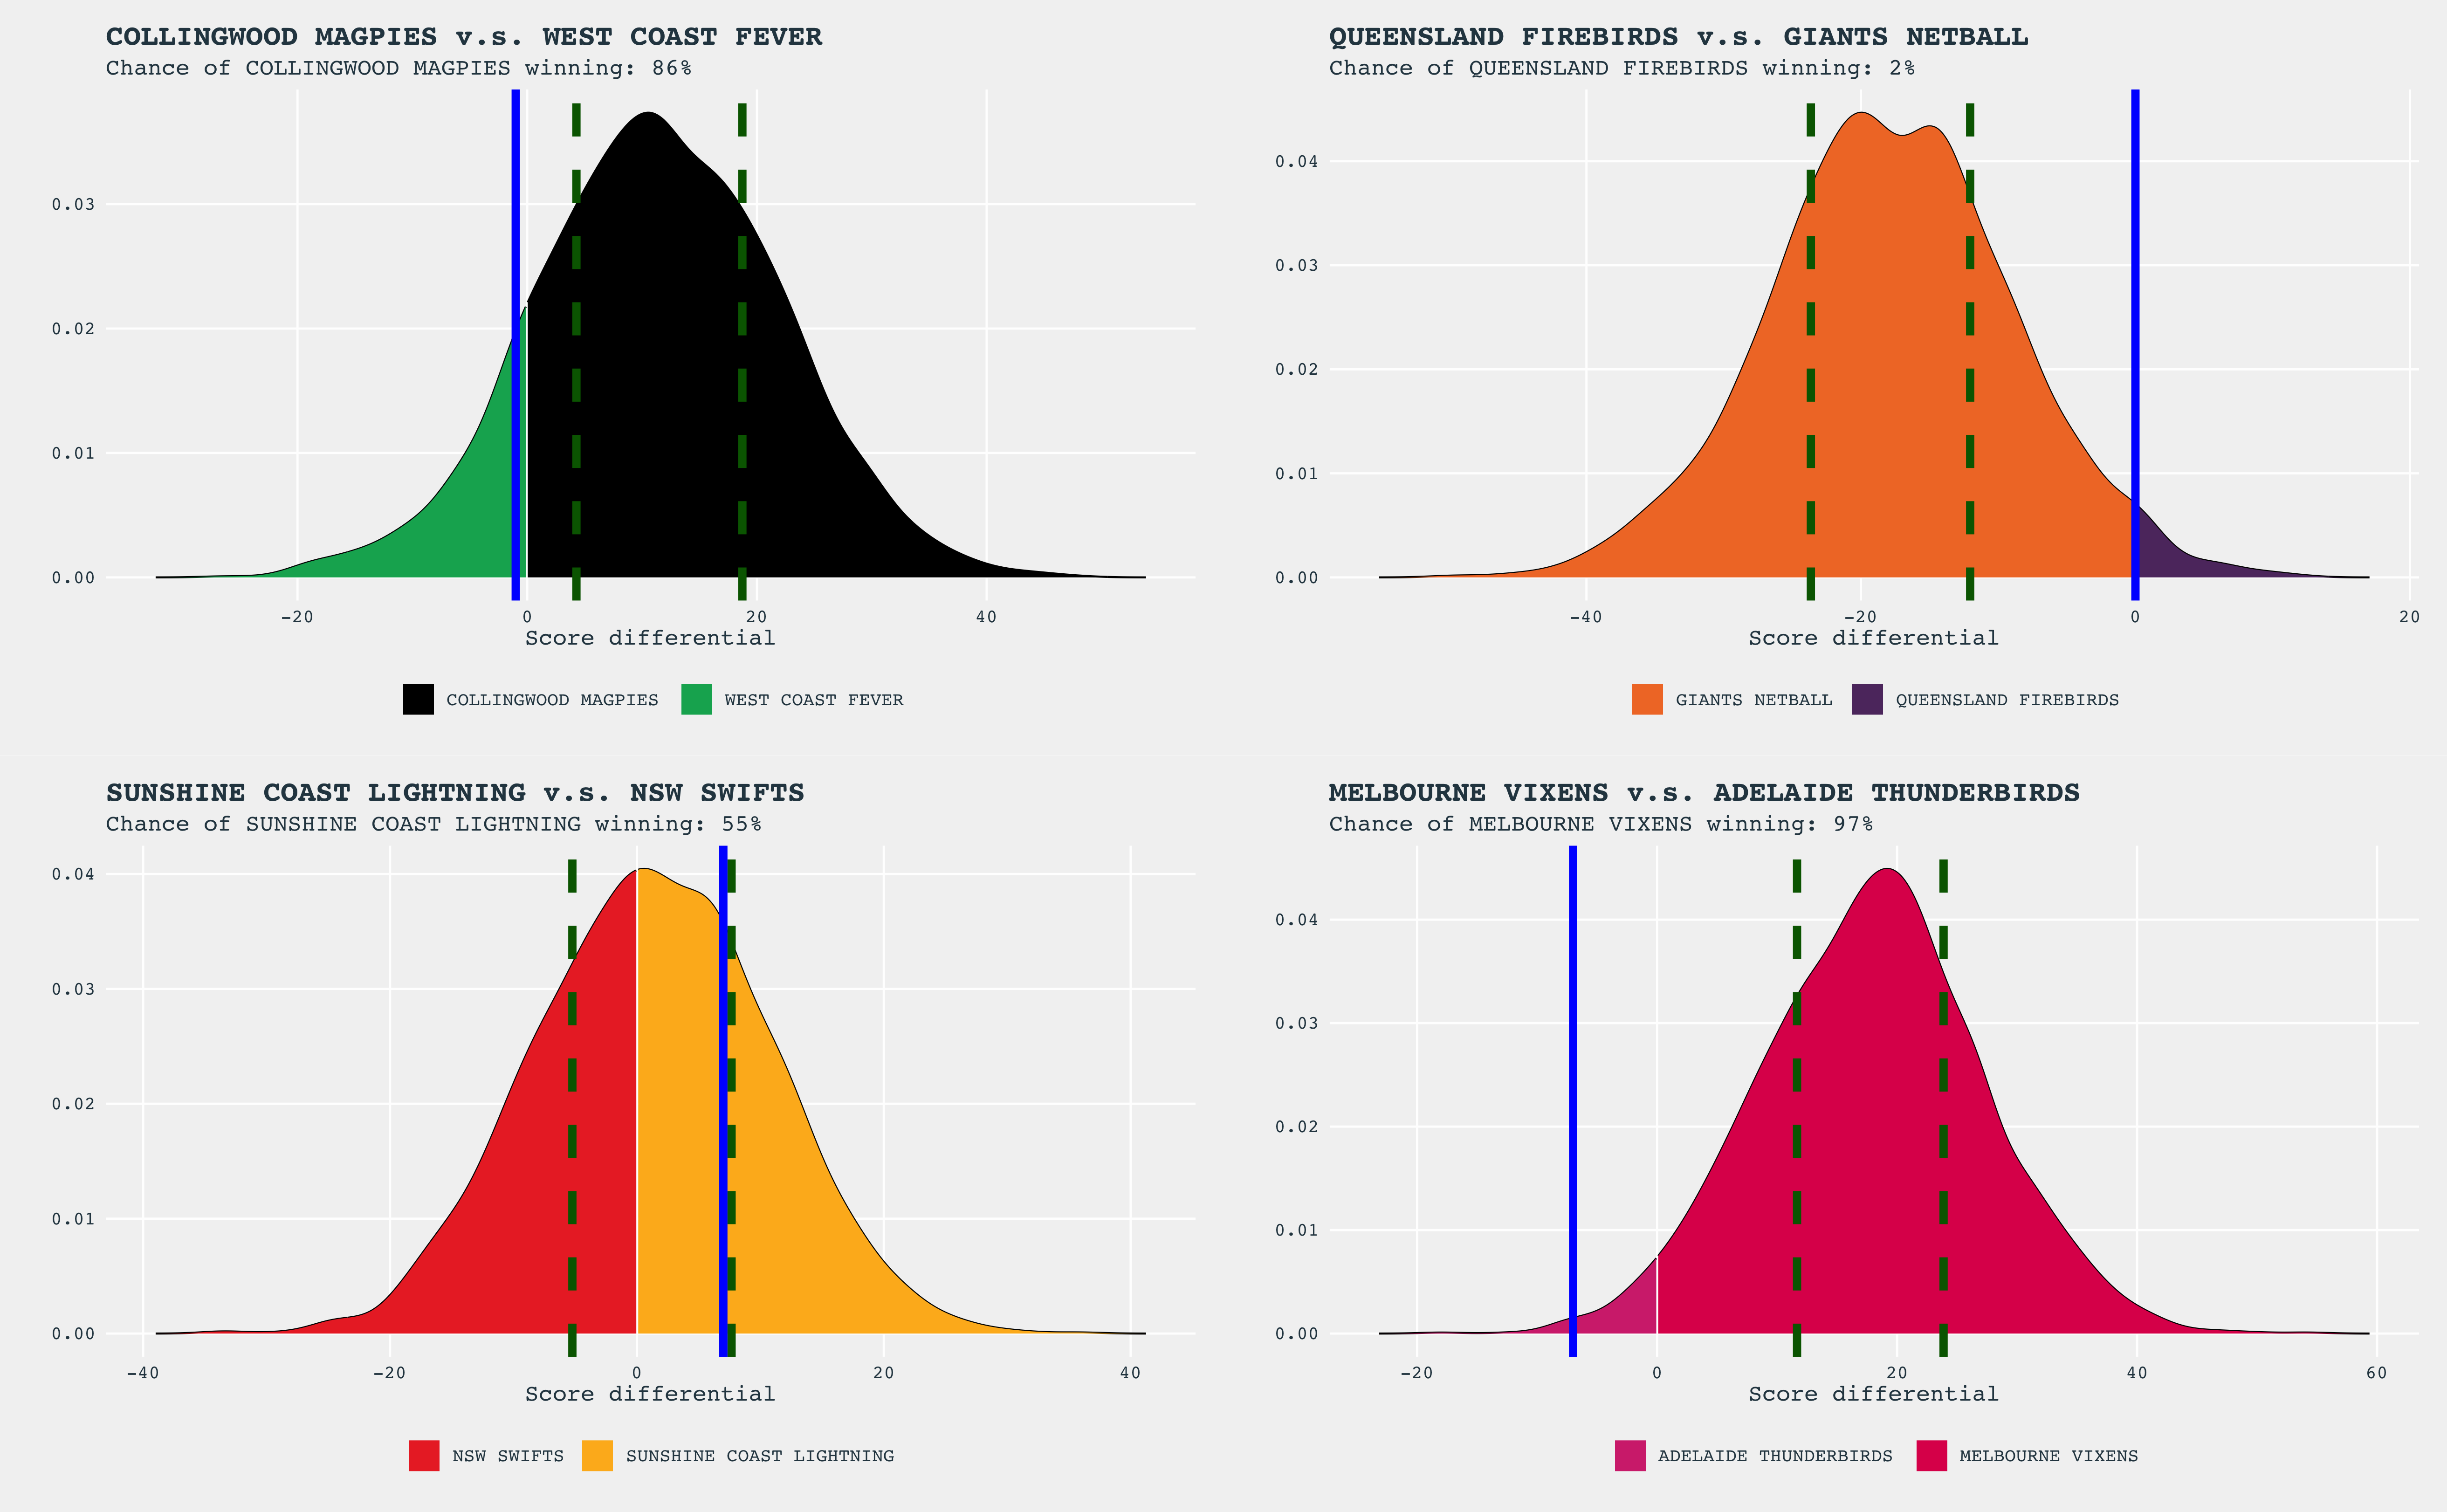
Comparison of Game Results Against Predictions
The following figure shows the results (score difference of the home team) in round 4 (blue vertical line) against the predictions from the model.
Non-HGA Model
I’ve also built a model that doesn’t utilise a home ground advantage parameter. Given the majority of teams don’t have a home crowd cheering them on, it seems unlikely that there’s any advantage to being named the ‘home team’ in a game. The non-hga predictions are below.