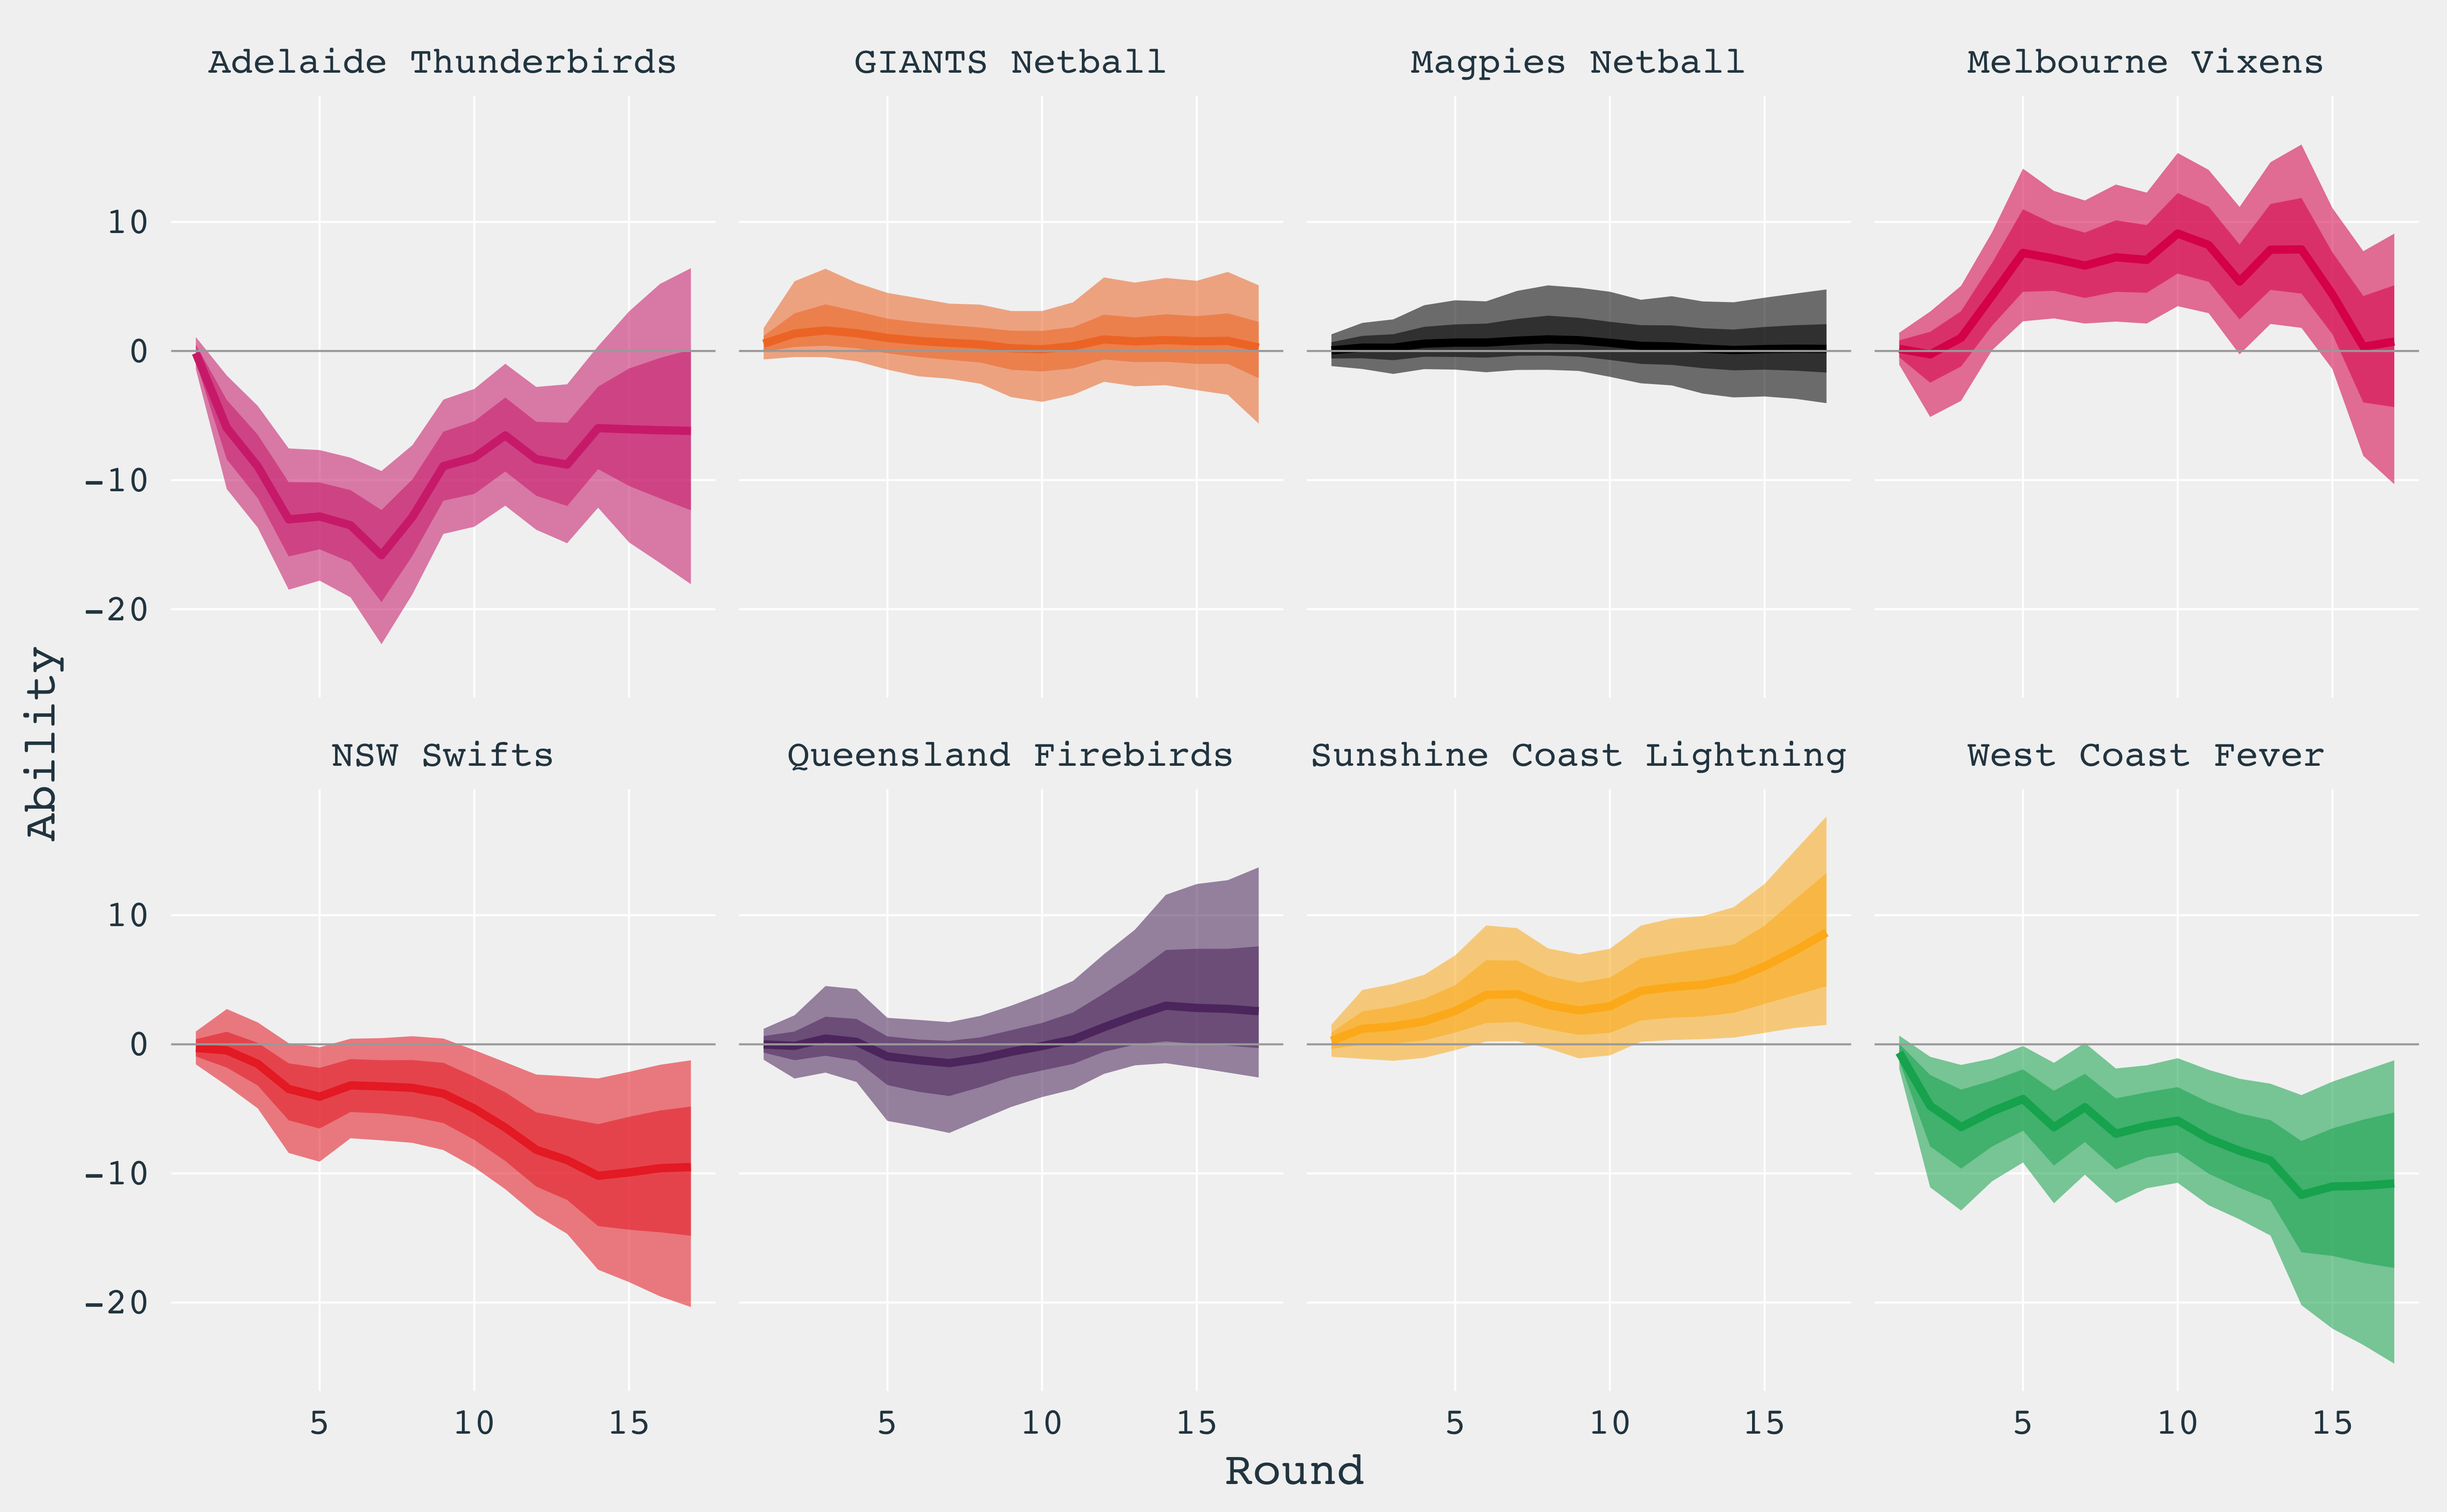
I recently put together a package for getting a hold of super netball data. It now comes time to start using it! The figure below shows the abilities (ratings) of each team at the end of the 2017 finals campaign. I’ll describe it soon.
The Model
I’m going to start off with a possibly naive, simplistic model, but we all have to start somewhere. I may tinker around with the model over the season, but will always report on when I make changes.
To estimate team abilities, I’m going to model the score differential of each game (I’ll use the home team’s score minus the away team’s score for this). To predict the score differential in each game, I’ll use an estimate of each teams ability, and a home ground advantage.
To estimate each team’s ability, I’m going to use a random walk model, where the ability for the current game depends on the ability in the previous game plus a disturbance term. Mathematically, it’ll look like this for team \(j\), round \(r\):
$$ \begin{align*} a_{j,r} & = a_{j, r-1} + \delta_{r} \end{align*} $$
To model the score differential, I’ll use a regression model with a \(t\) distribution as the outcome distribution:
$$ \begin{align*} d_{r,ij} & \sim t_{\nu}(\beta_{i} + a_{i,r} - a_{j,r}, \sigma_{d}) \end{align*} $$
where \(d_{r,ij}\) is the score differential between teams \(i\) and \(j\) in the \(r\)th round, and \(\beta_{i}\) is the home ground advantage of team \(i\).
This has already got complex enough, but I set it all up in a Bayesian framework, using the excellent Stan. You can find the model code and other bits and bobs here.
Team Ability and Home Ground Advantage
The figure that I included above shows all team’s abilities at the end of the 2017 finals campaign. What this means, is that for those teams that didn’t make the finals (or were knocked out during the finals campaign), their ability is a prediction from the model at the end of the season.
There’s no real surprises in that the Sunshine Coast Lightning finished the season with an increasing ability rating; they were the competition winners after all!
The abrupt fall in the Vixens ability after round 12 is due to their loss to the Giants. At this stage of the competition, the Vixens would have been highly fancied to win that game, so there is a large correction in their ability due to the unexpected loss.
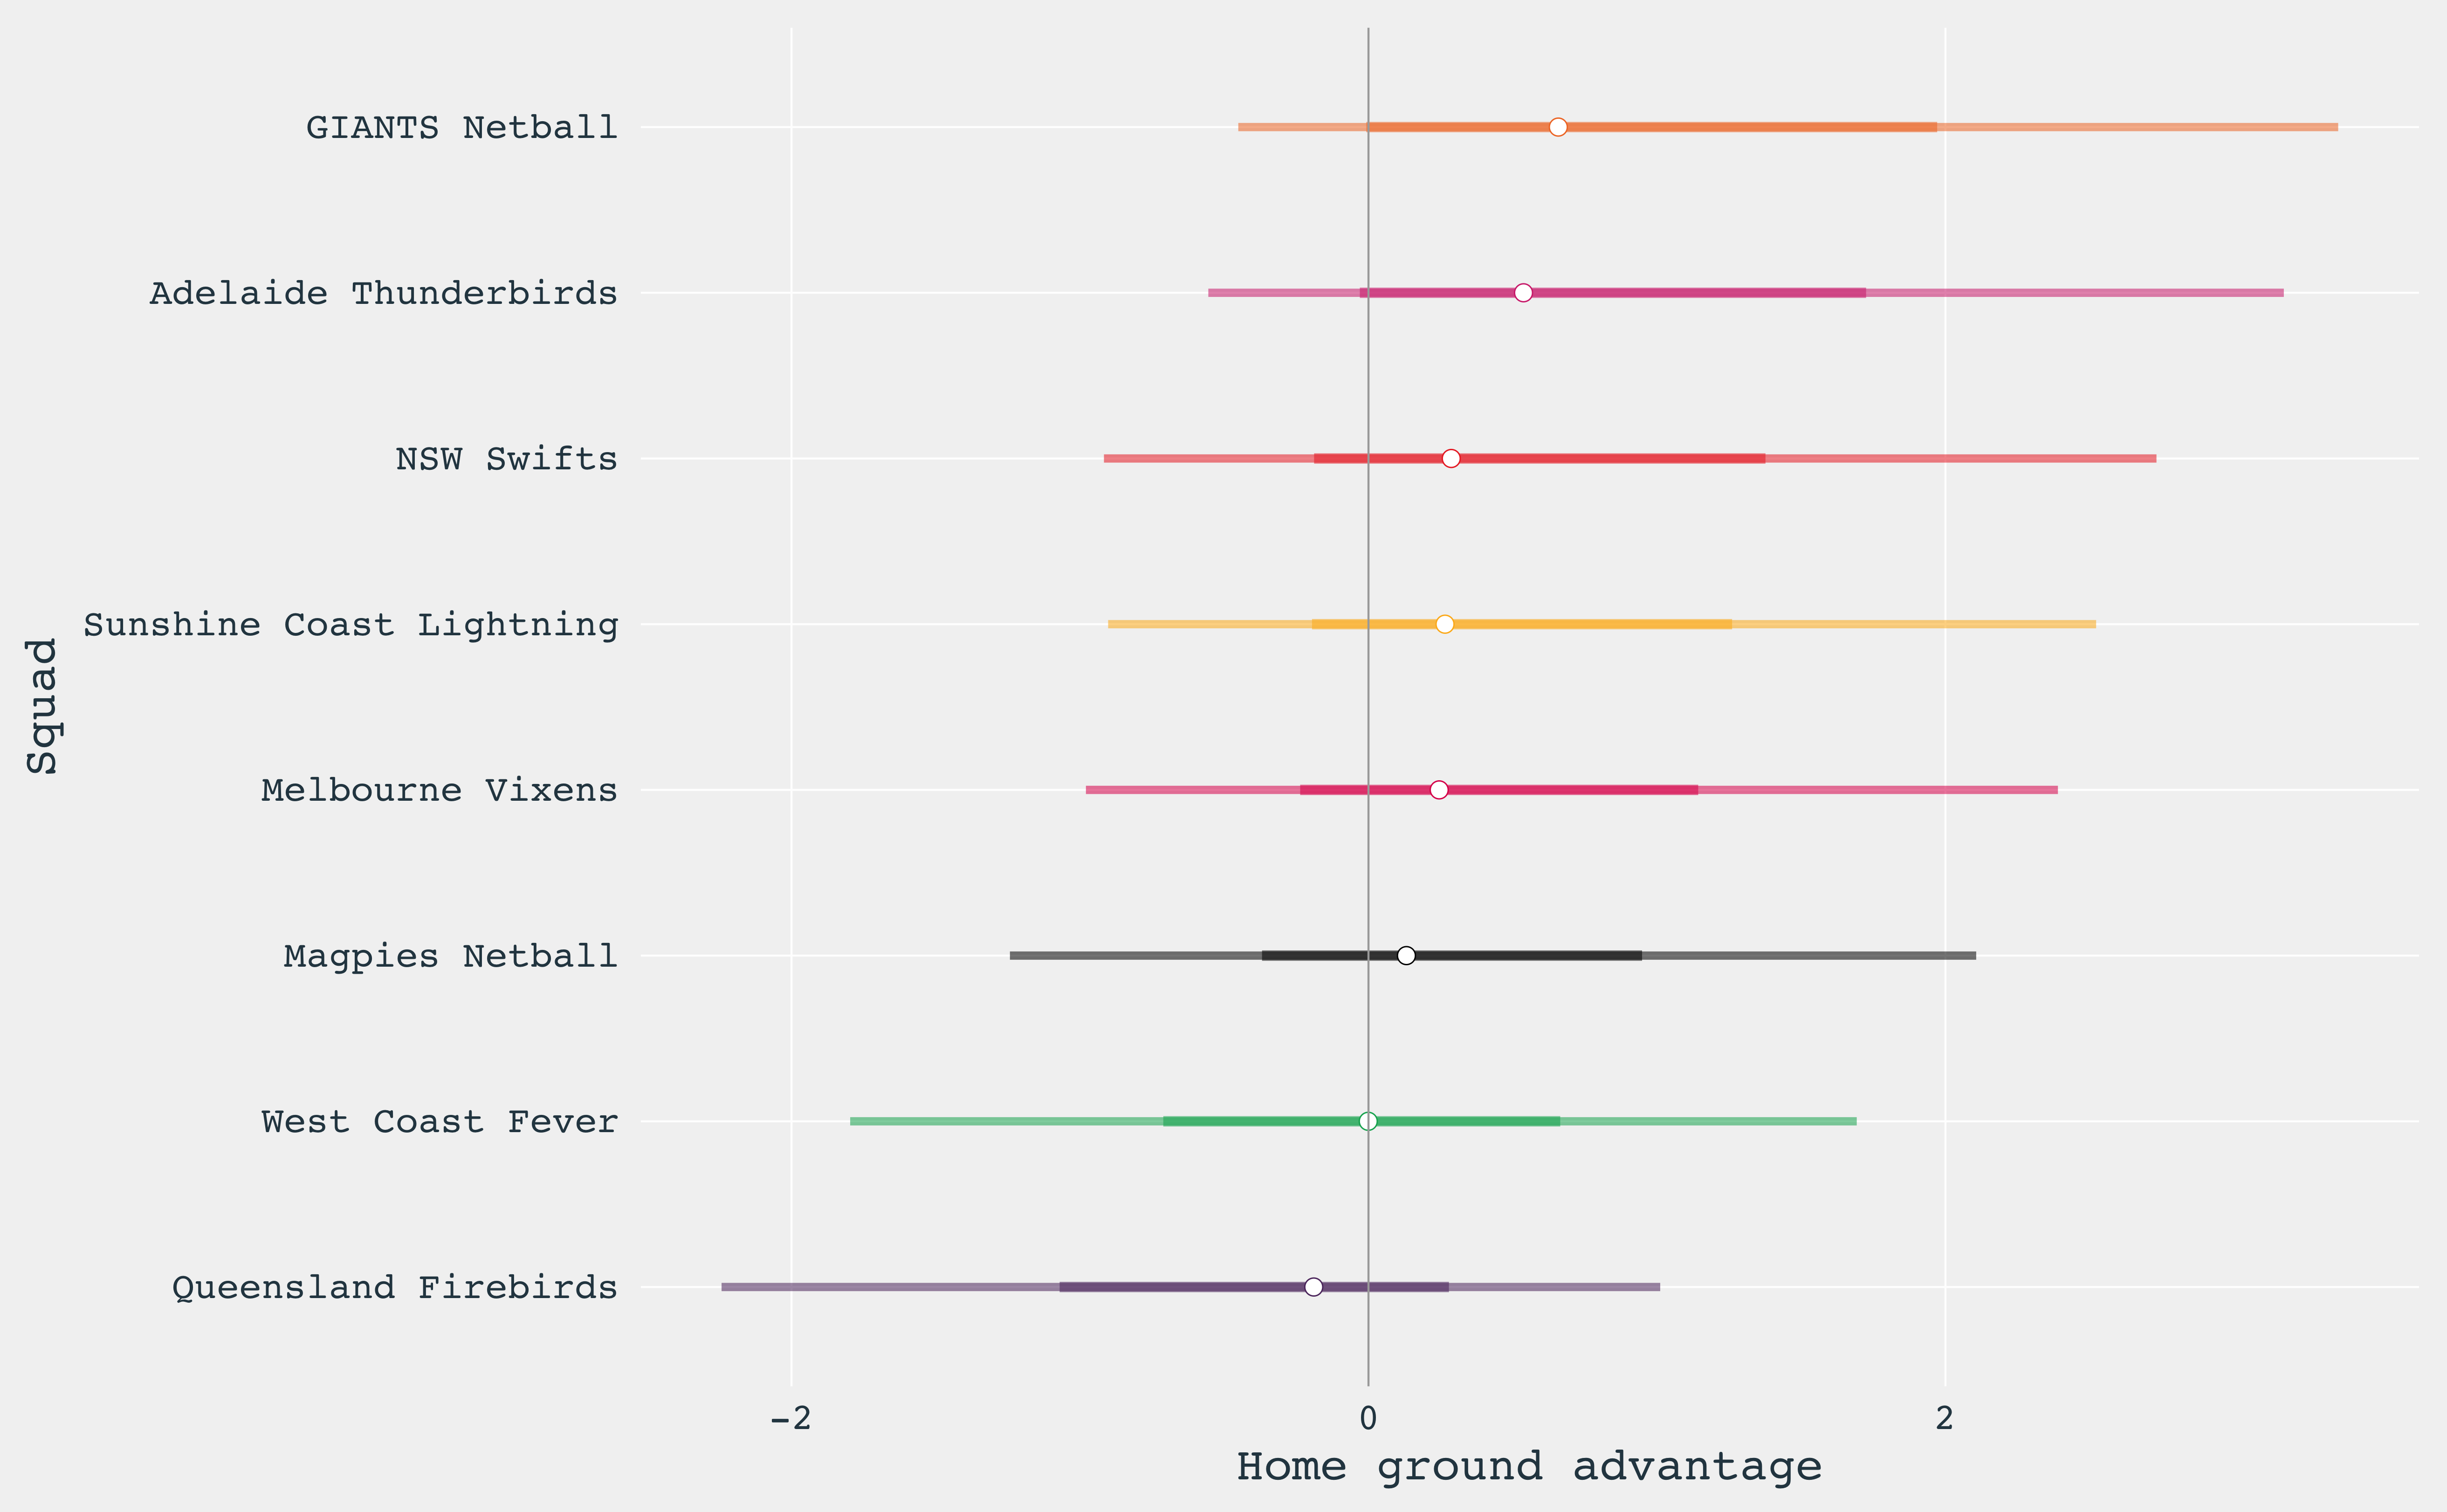
The next figure shows the home ground advantage. There’s no distinct home advantage for any team. It looks as though Giants may get a boost playing at home, but at best, this is a two to three goal advantage. The Firebirds are the only team with most of their predicted home ground advantage distribution lying below zero.
What is surprising is the Thunderbirds home ground advantage. For a team that finished bottom of the ladder, this would suggest that their losses may have been even more severe if it weren’t for the advantage playing at home.
Moving Forward
I’ll try and update predictions for the 2018 season before the games, with some possible summaries for how teams abilities are tracking.
To keep updated, follow me on twitter, and also this blog — look for the Super Netball category.