UPDATE: with the rearrangement of games due to Covid-19, I’ve updated the predictions; the predictions below represent the current round 1 fixture as at 19:30, 29th July.
The first round of the 2020 Super Netball season is on us! This is going to be one weird season with the whole Covid-19 happening and all teams being based in Queensland.
To kick this season off, I’ve used the team abilities from my model after the finish f the home and away matches in 2019 to create prior distributions for the 2020 season. To refresh your memory, here’s a description of how my model works. The issue with this season is that a home ground advantage is going to be something that’s really hard to define conceptually. At least the first round of games will not have spectators (for the Victorian clubs), but moreso, you’d have to think the two Queensland clubs would be at an advantage for home ground advantage. At this late point leading up to the start of the season, I haven’t had time to revisit the model and tweak the HGA. Perhaps later in the season I’ll get that chance.
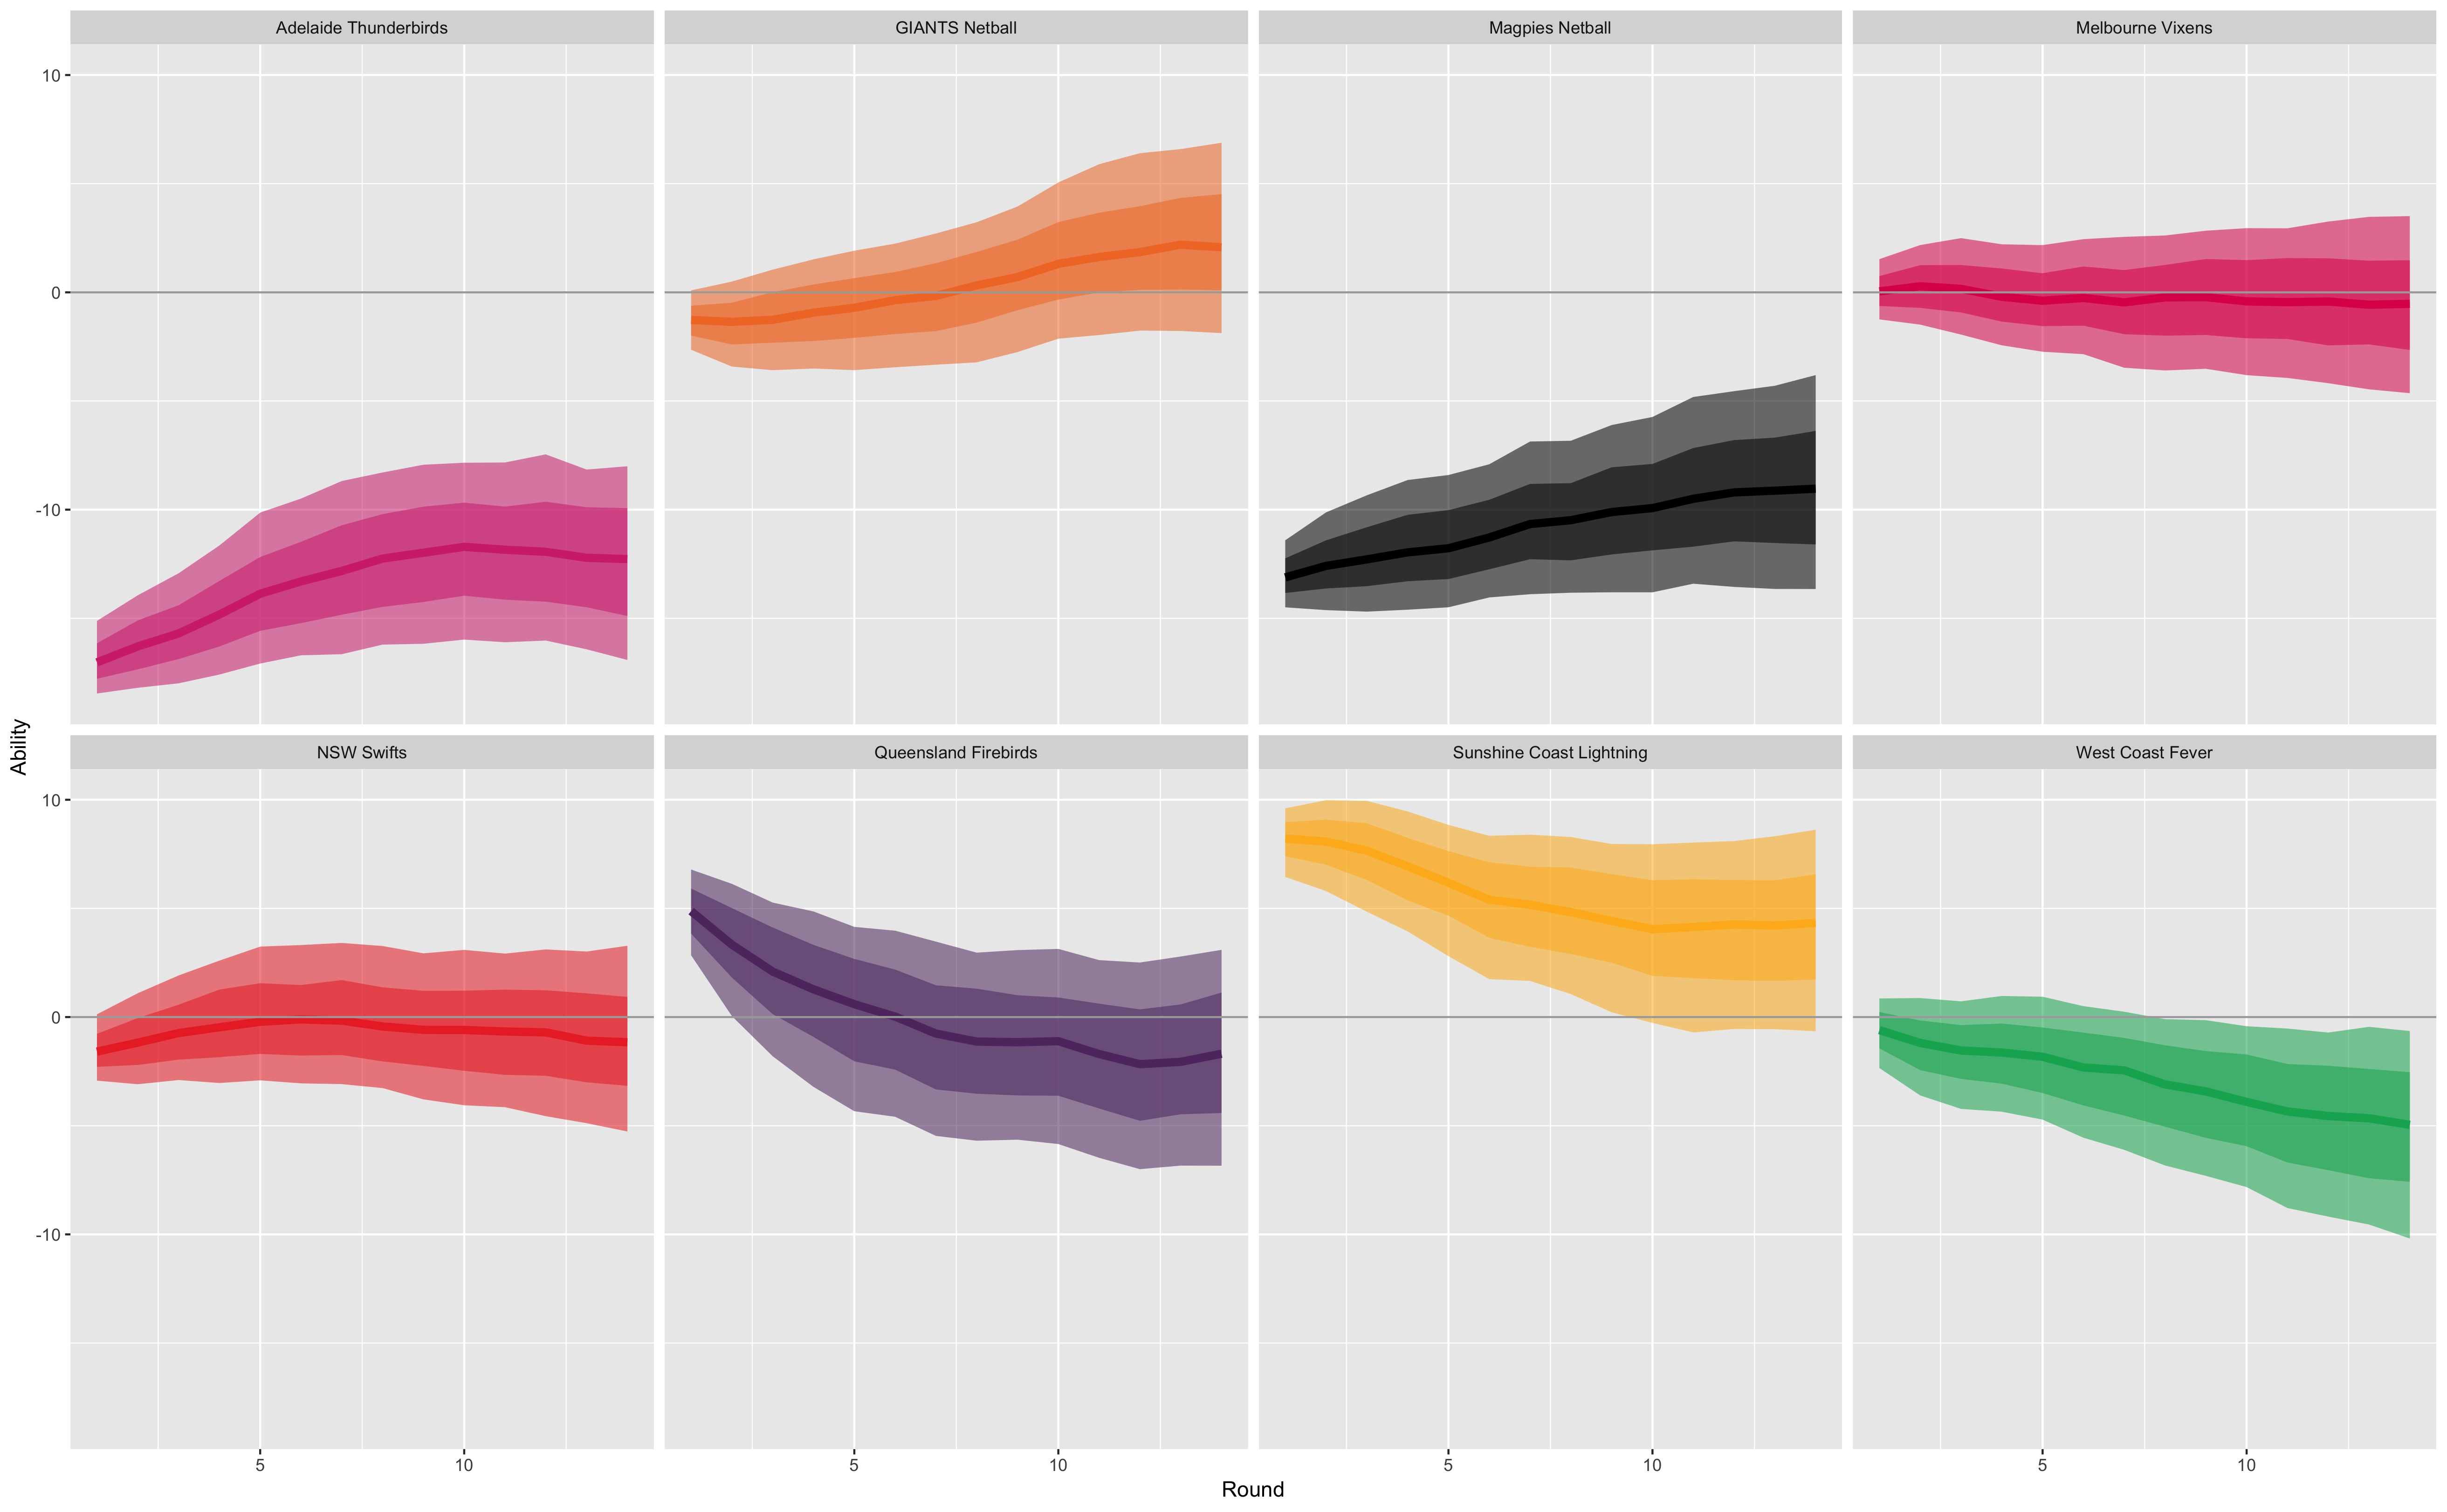
The figure below shows how the model had the teams after the end of home and away matches in 2019.
Predictions for the first round are given in the table below. The priors for these distributions are based purely on the final abilities from last season and do not account for any roster changes in the teams. Furthermore, the model uses score differentials to make predictions, so it will take a few rounds for the model to calibrate.
| Home | Away | Chance of home team winning |
|---|---|---|
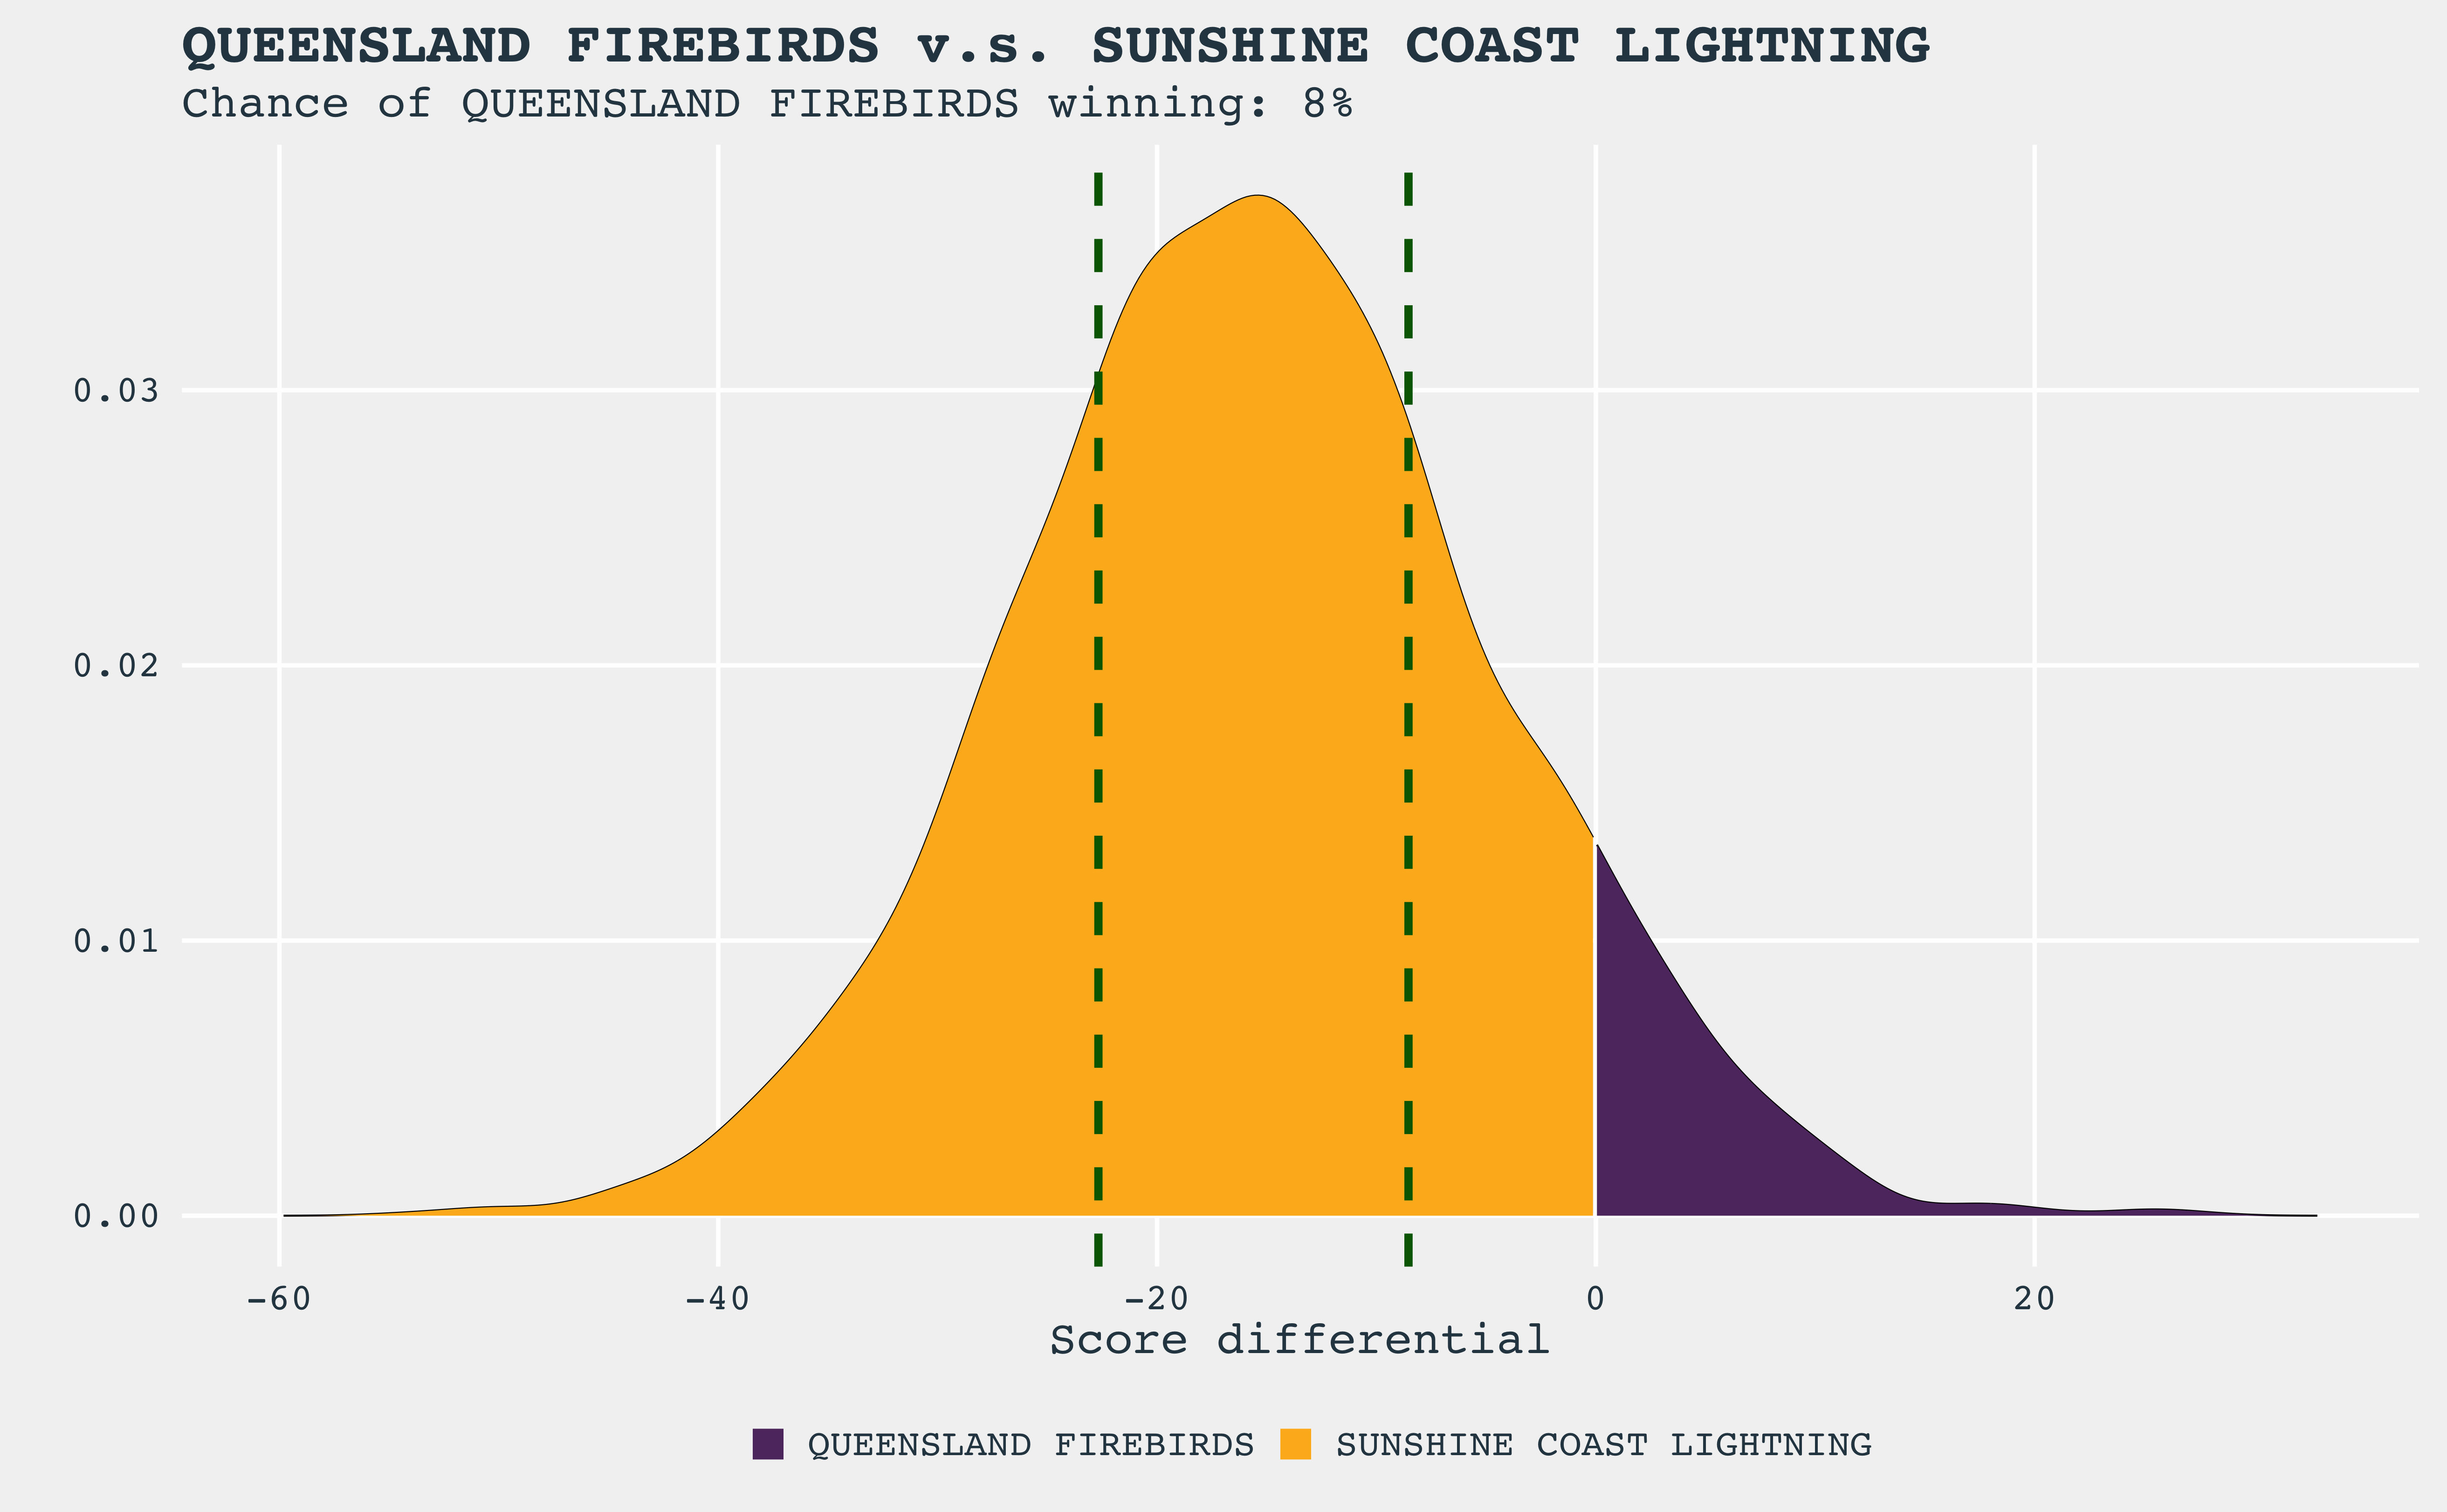
| Queensland Firebirds | Sunshine Coast Lightning | 8% |
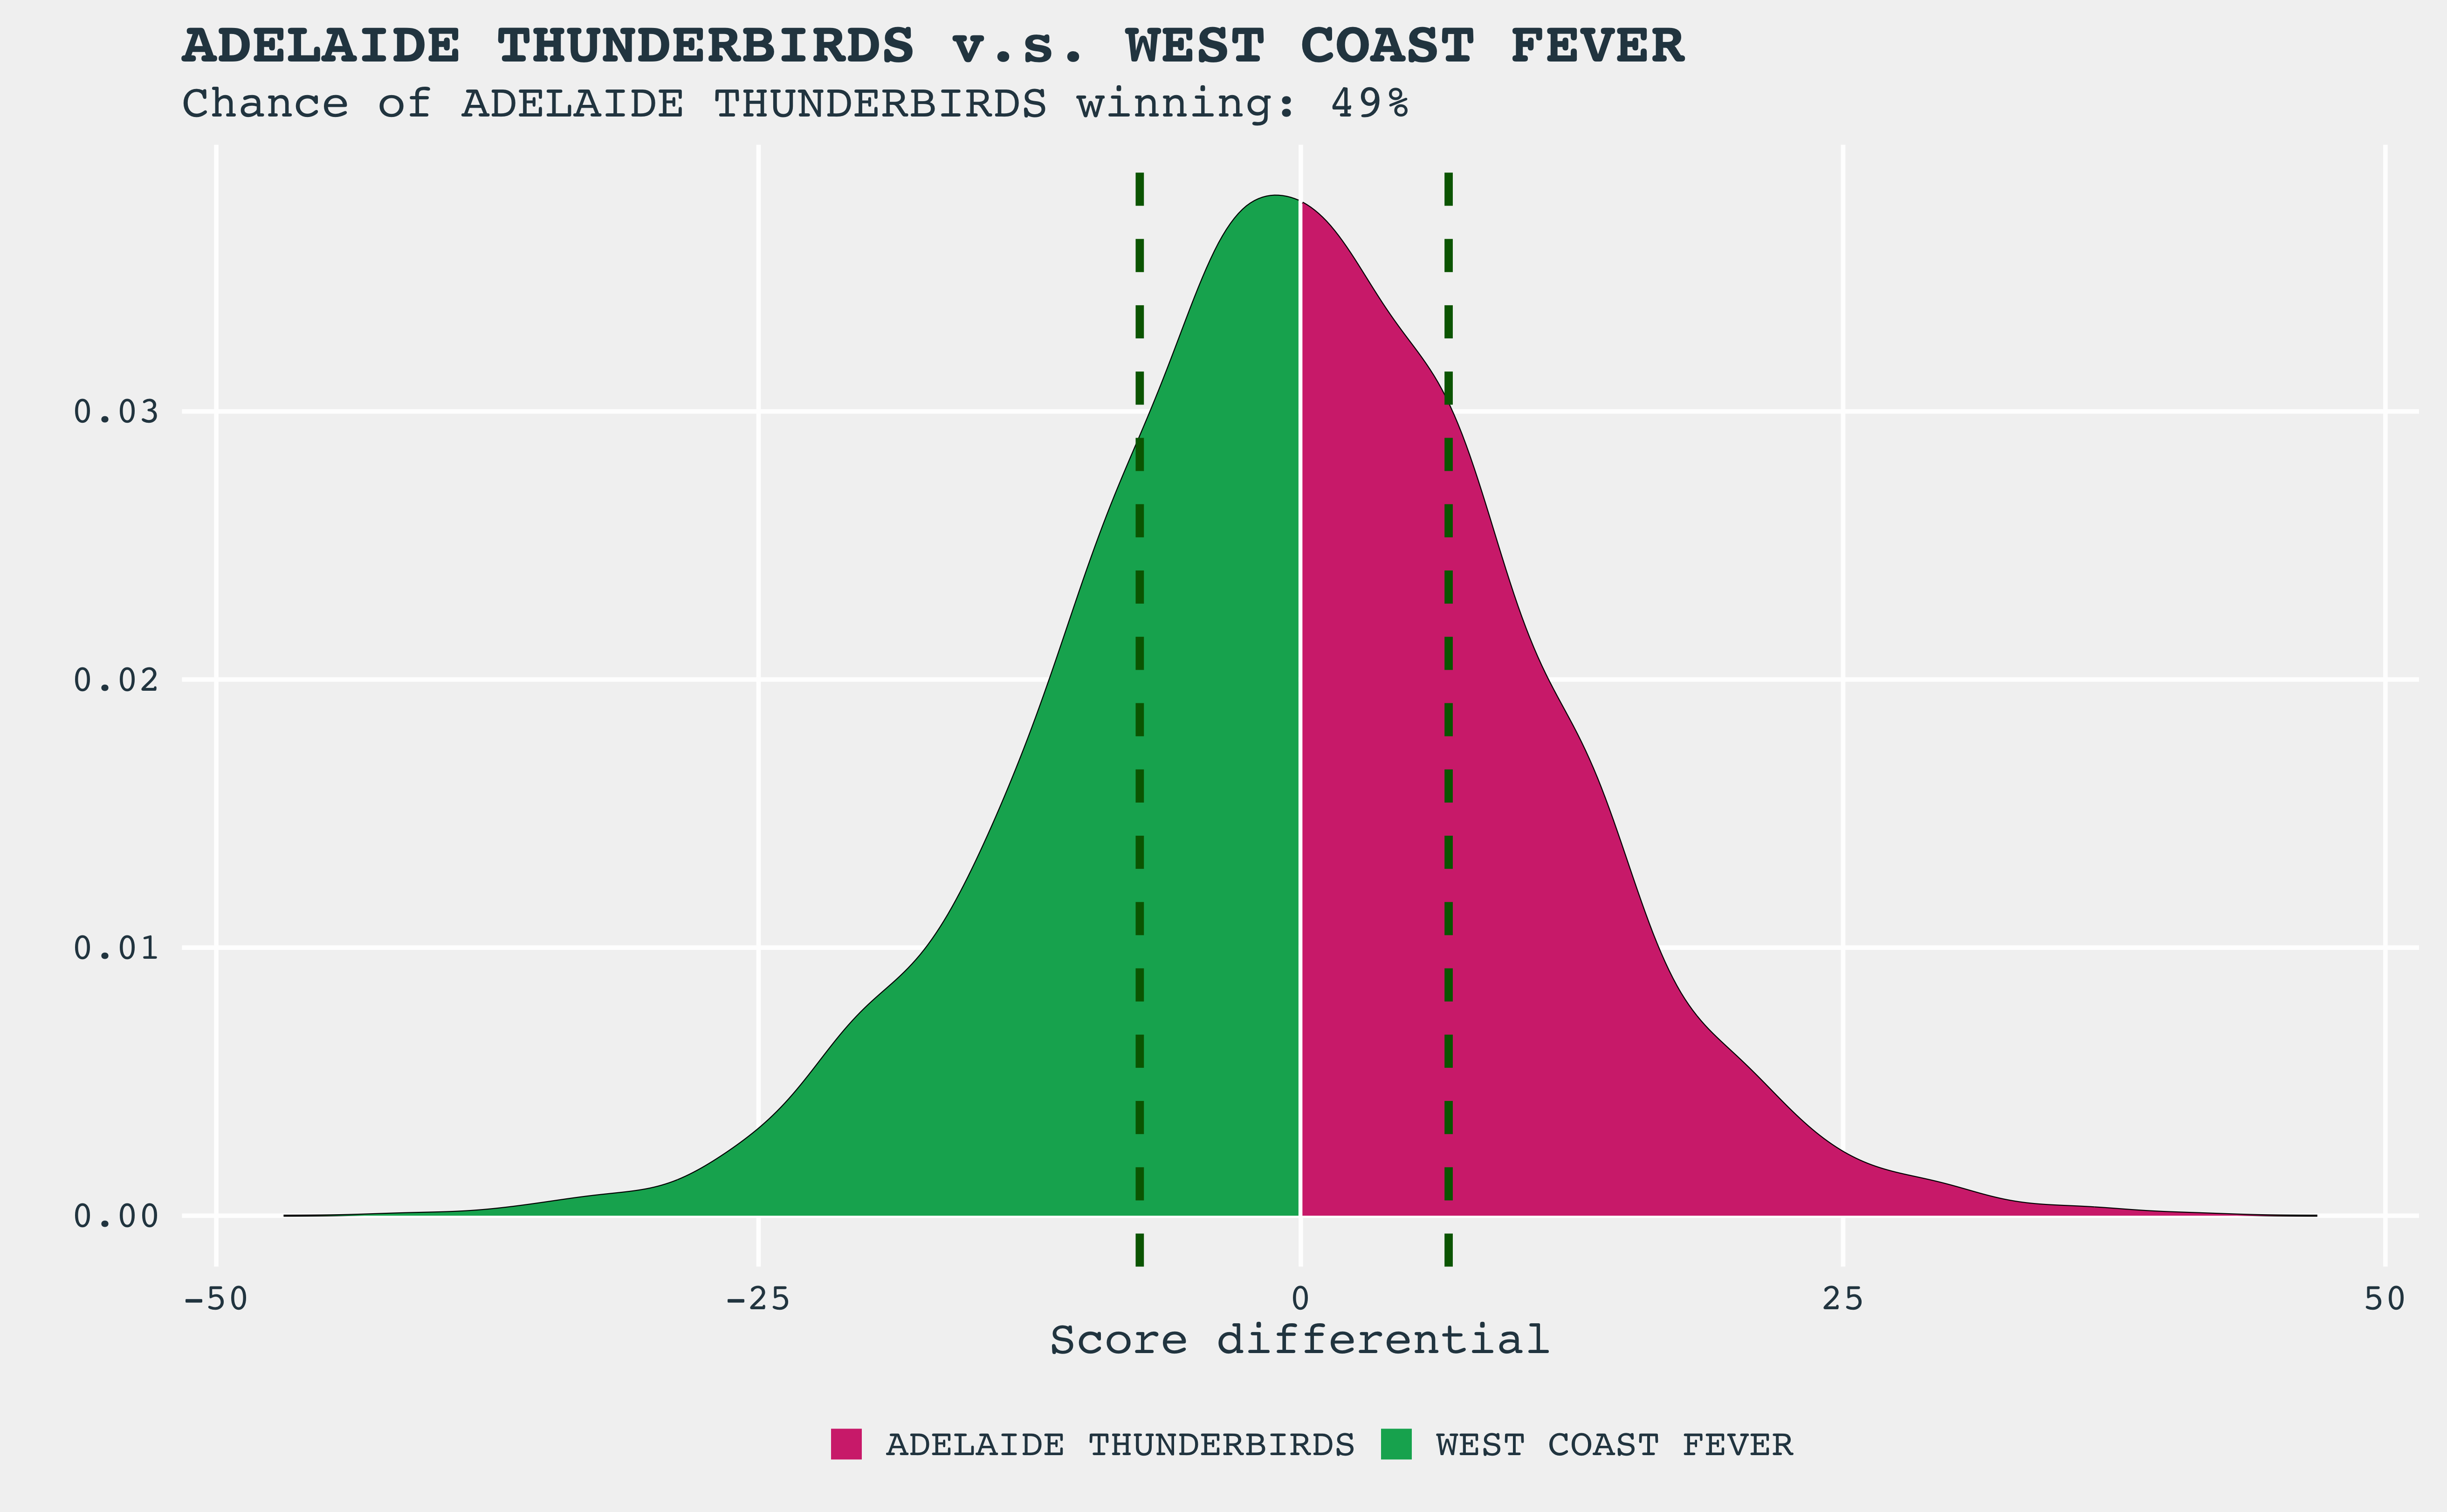
| Adelaide Thunderbirds | West Coast Fever | 49% |
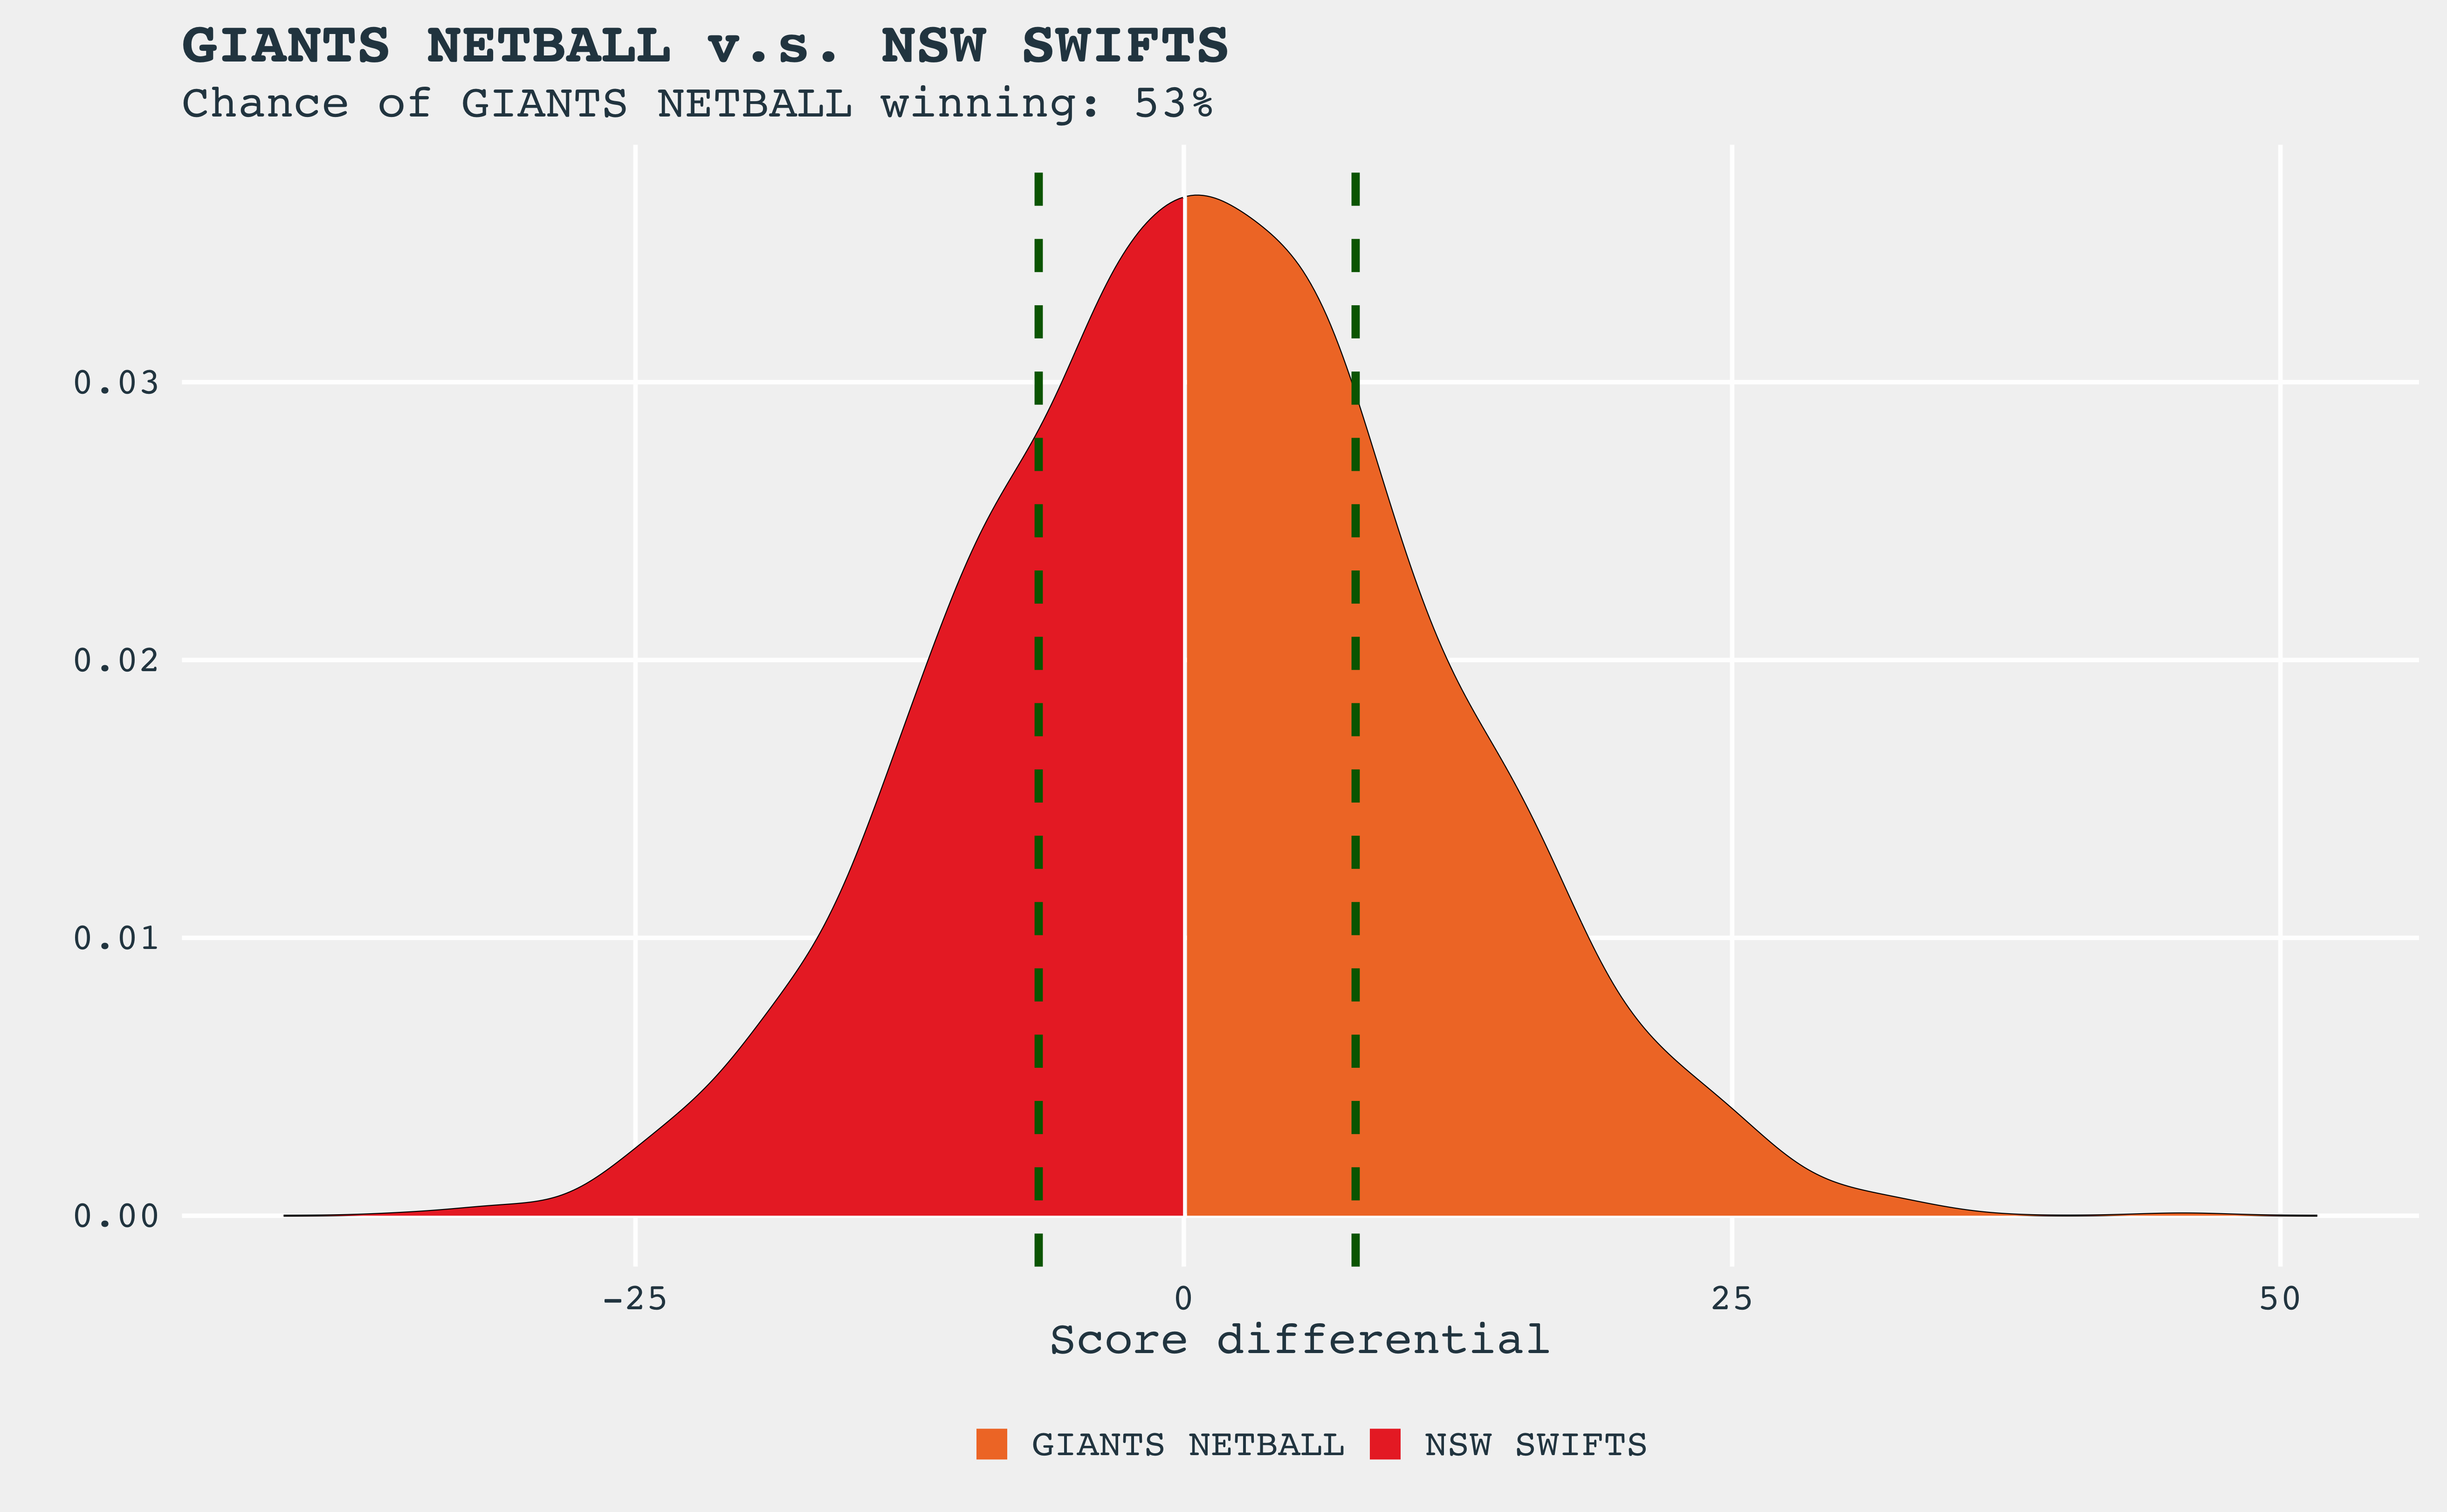
| GIANTS Netball | NSW Swifts | 53% |
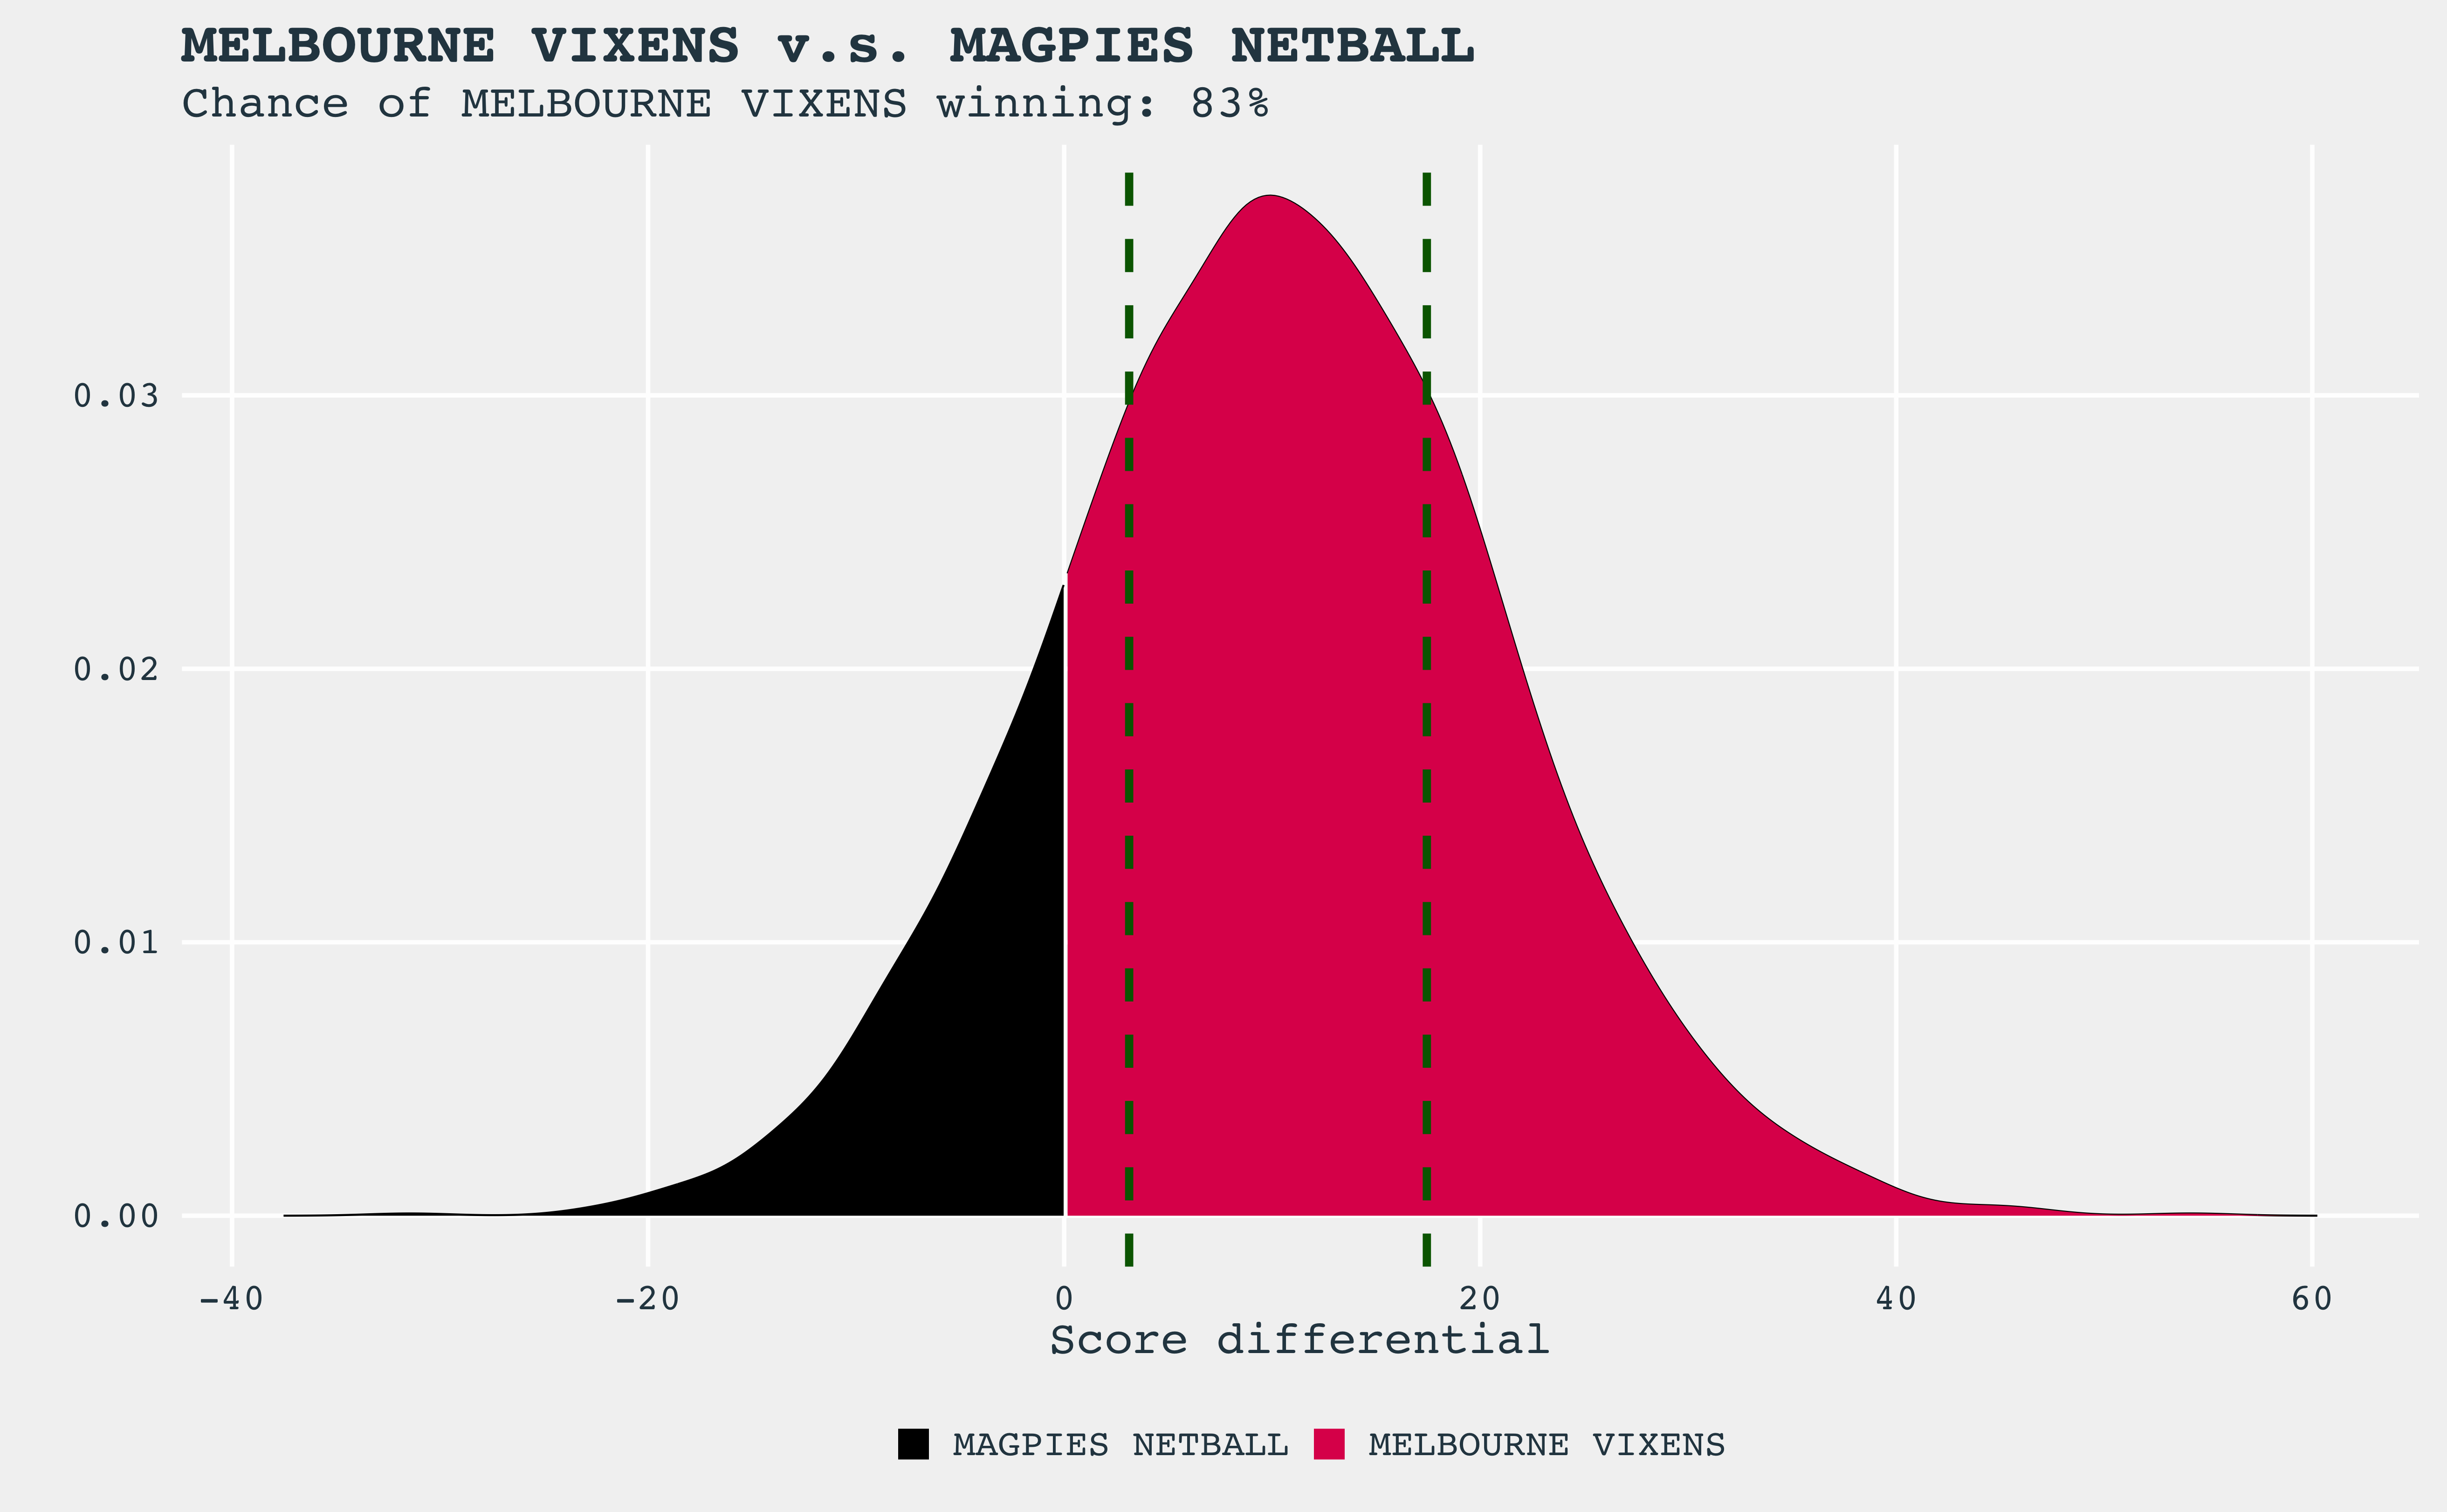
| Melbourne Vixens | Magpies Netball | 83% |
Score Differential Distributions
The distribution of the predicted score differentials is shown in the figures below. For each game, the chance of the home team winning is calculated and shown in the figure title. Each distribution is coloured by the team’s colours, and the more of a single team’s colour, the higher the chance that team has of winning. Overlaid on each figure are two vertical, dashed dark green lines; these show the score differential that has a 50% predicted chance of happening.