Again with the delays! But here we go with the predictions, at least I can get those out reasonably quickly. The commentary is just too hard at the moment! The Giants are coming off a couple of wins, but not against quality teams, so it’s surprising to see that the model has rated them so highly against the Lightning. Top of the ladder Swifts have the edge over the Vixens thanks to a superior home ground advantage.
Predictions for round 12 are given in the table below.
| Home | Away | Chance of home team winning |
|---|---|---|
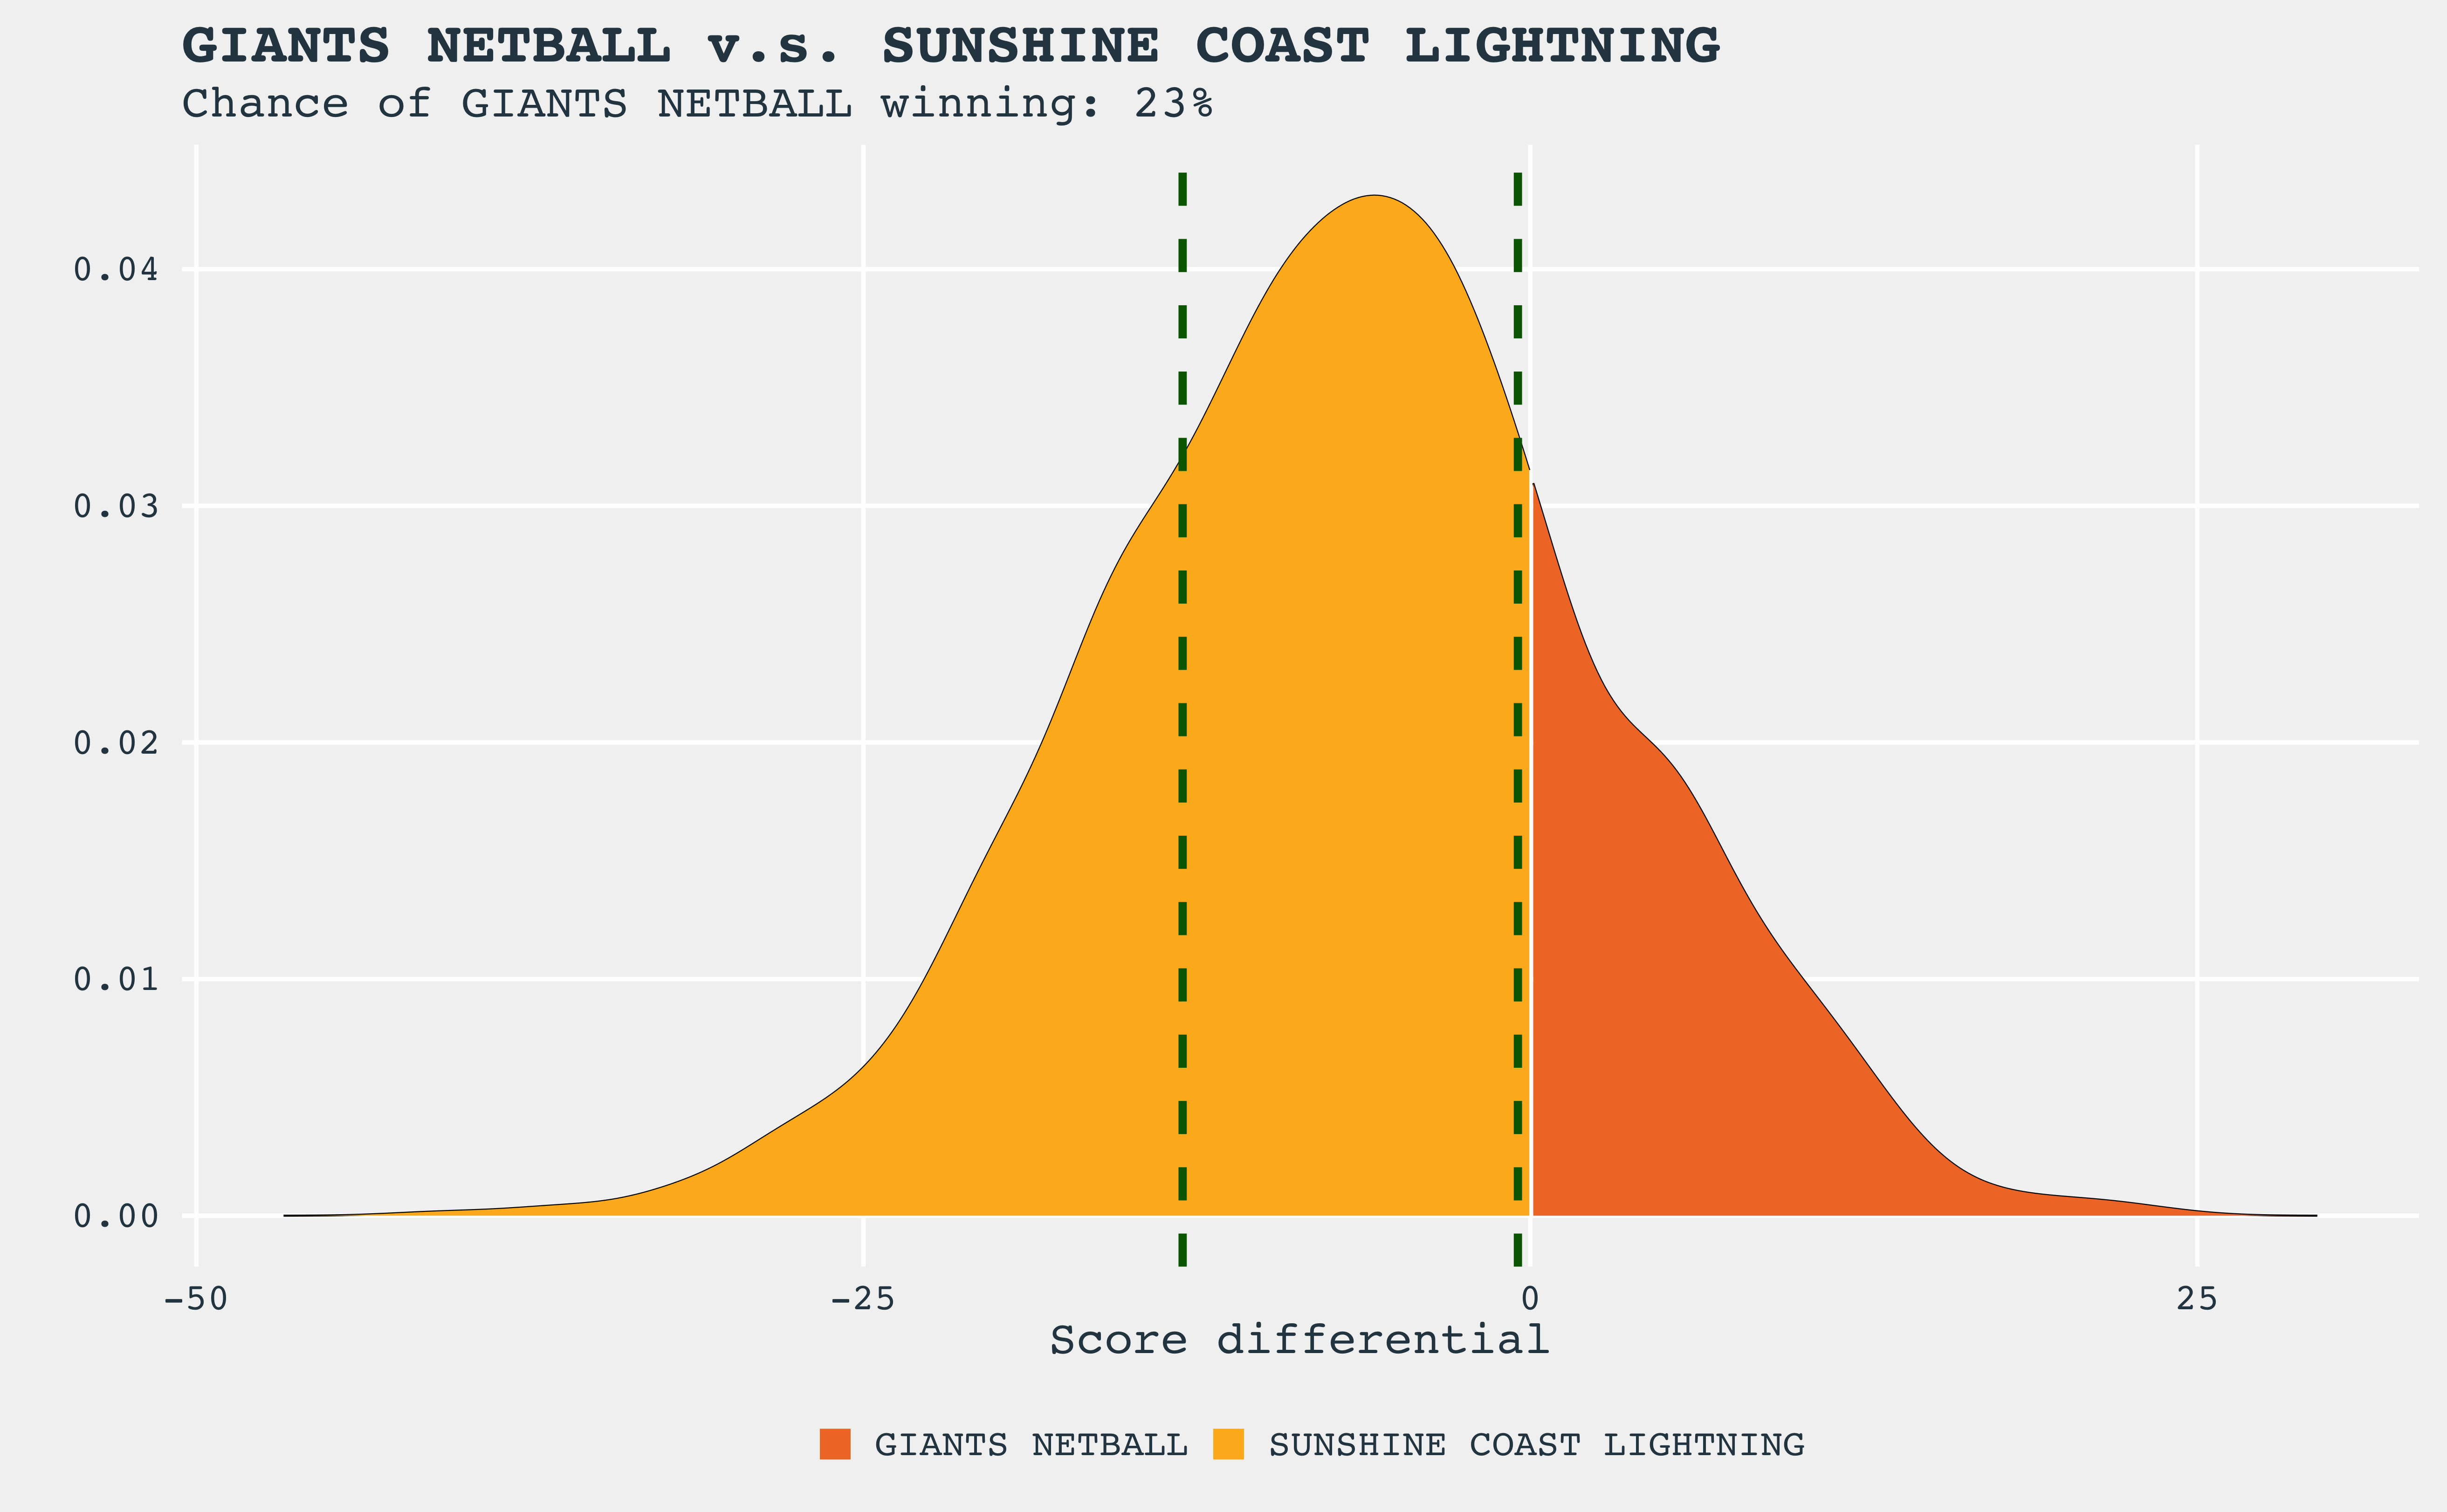
| GIANTS Netball | Sunshine Coast Lightning | 23% |
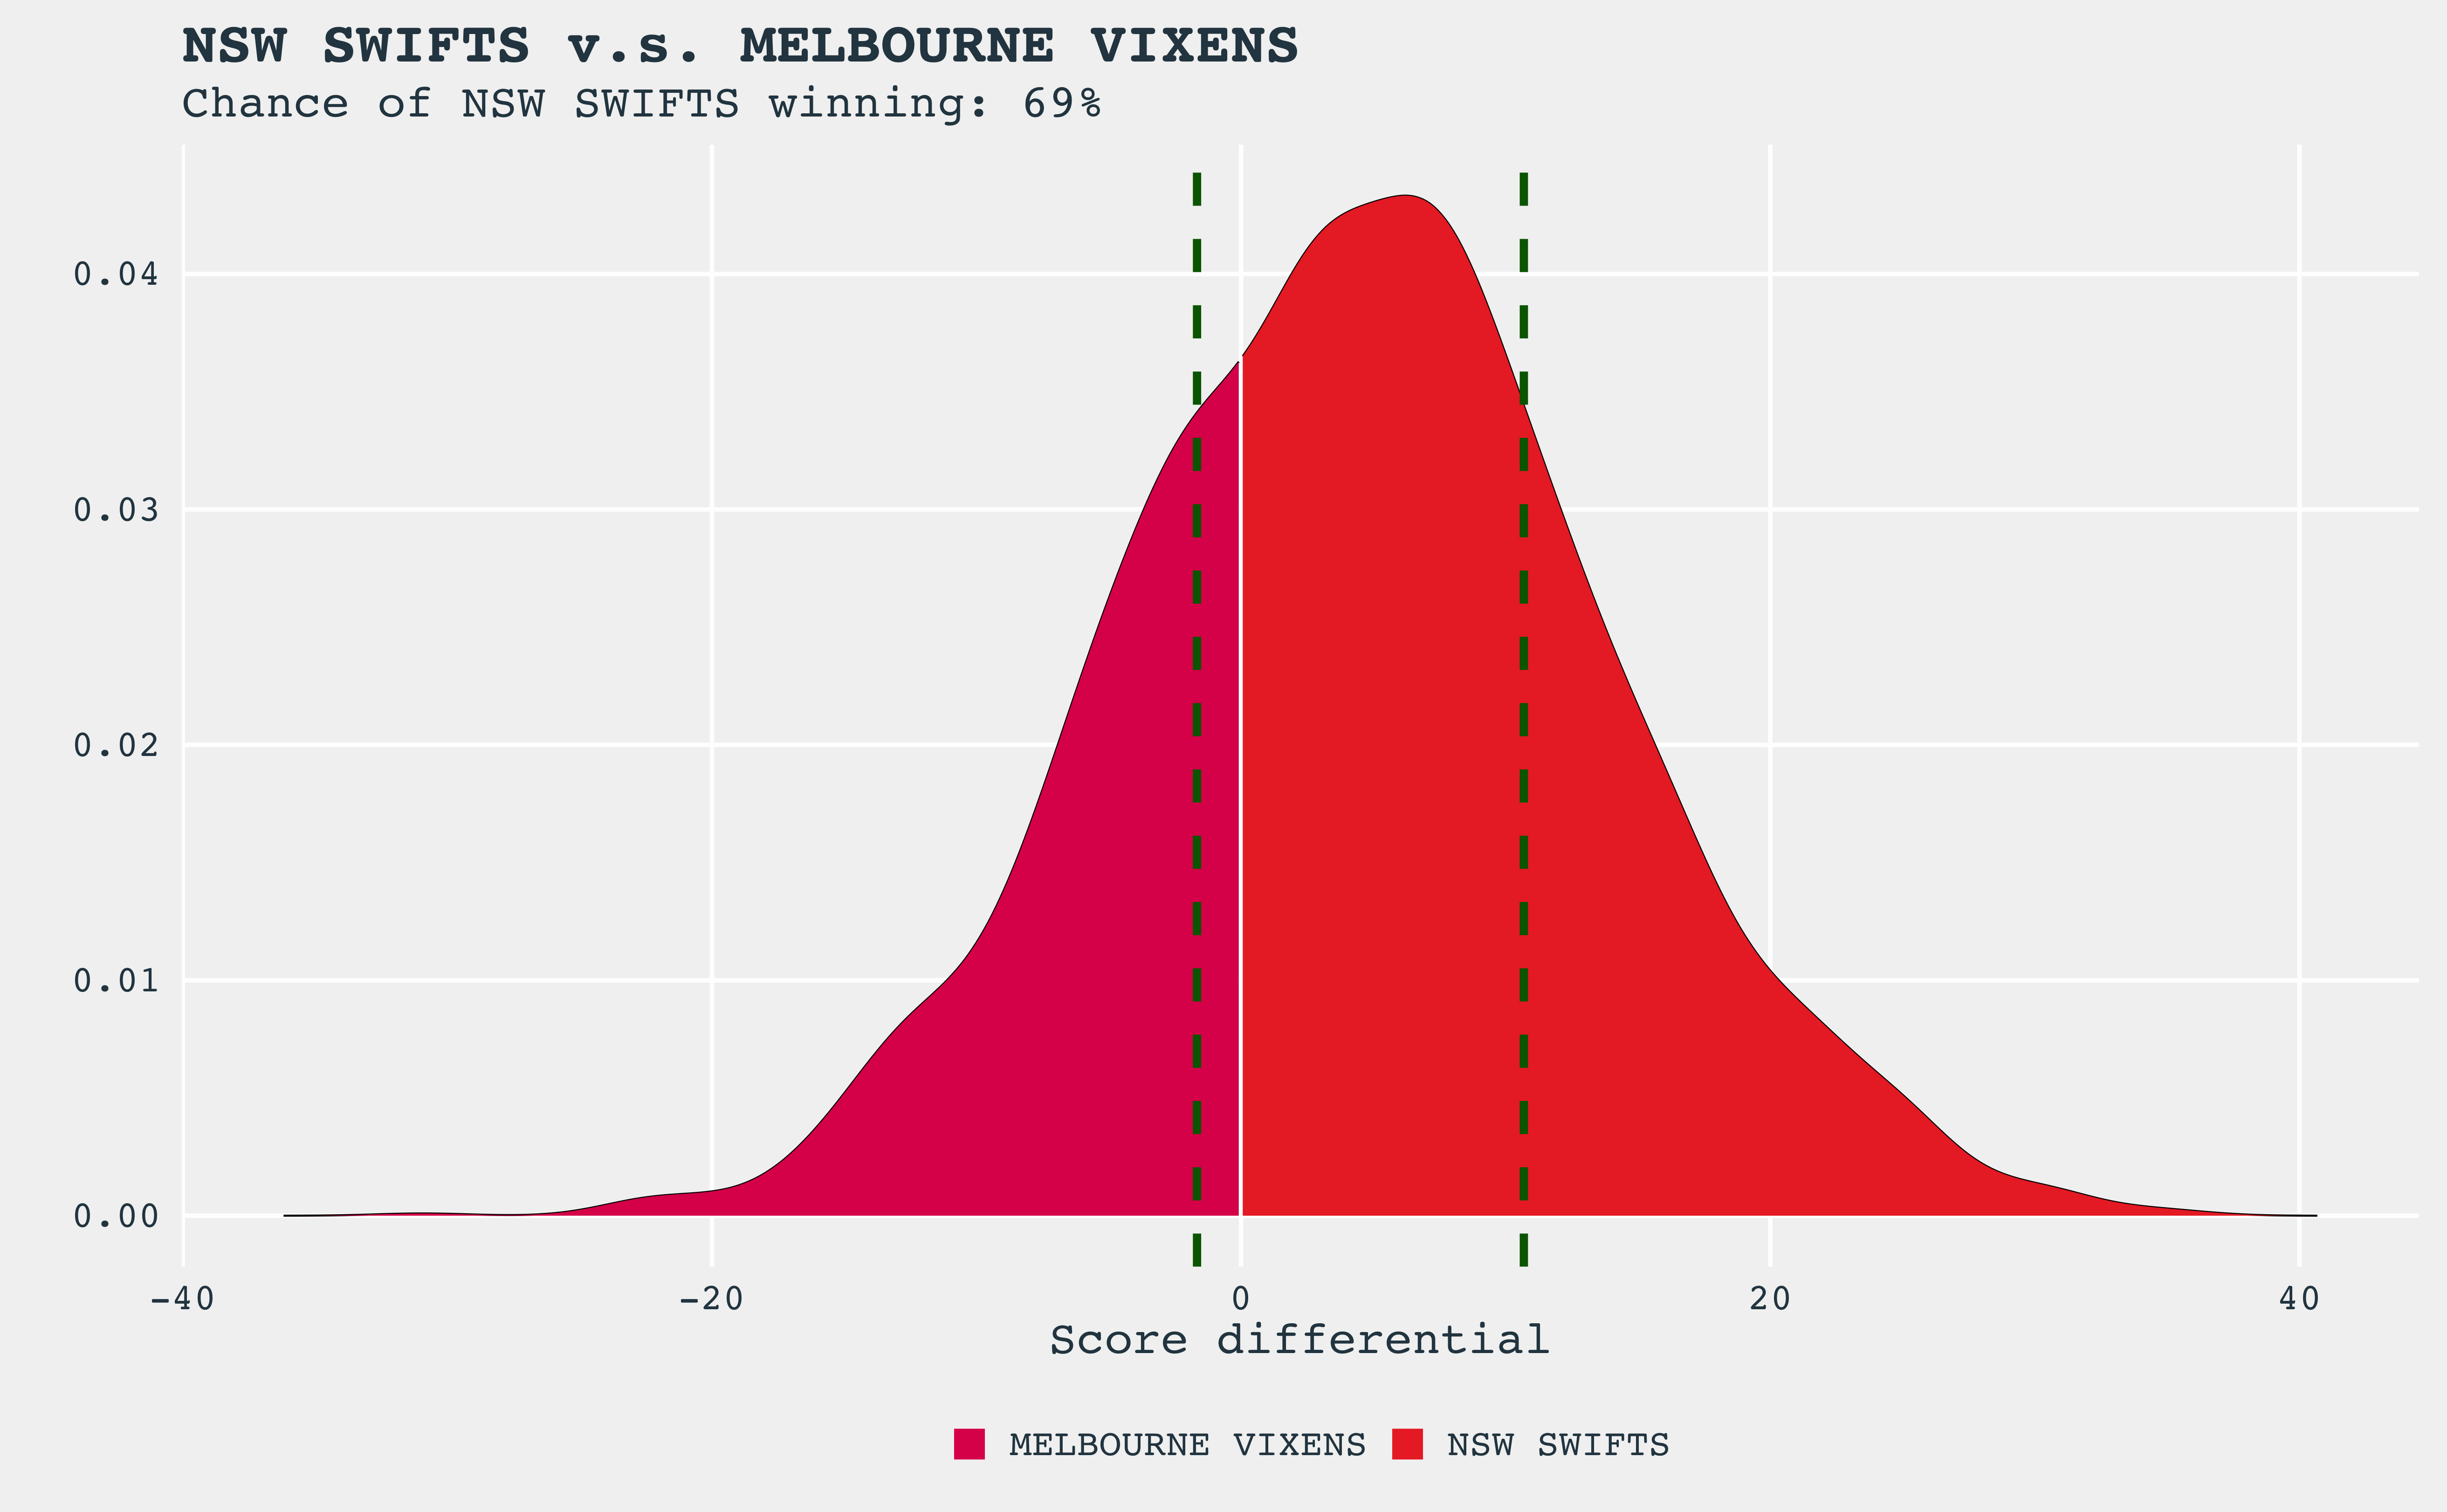
| NSW Swifts | Melbourne Vixens | 69% |
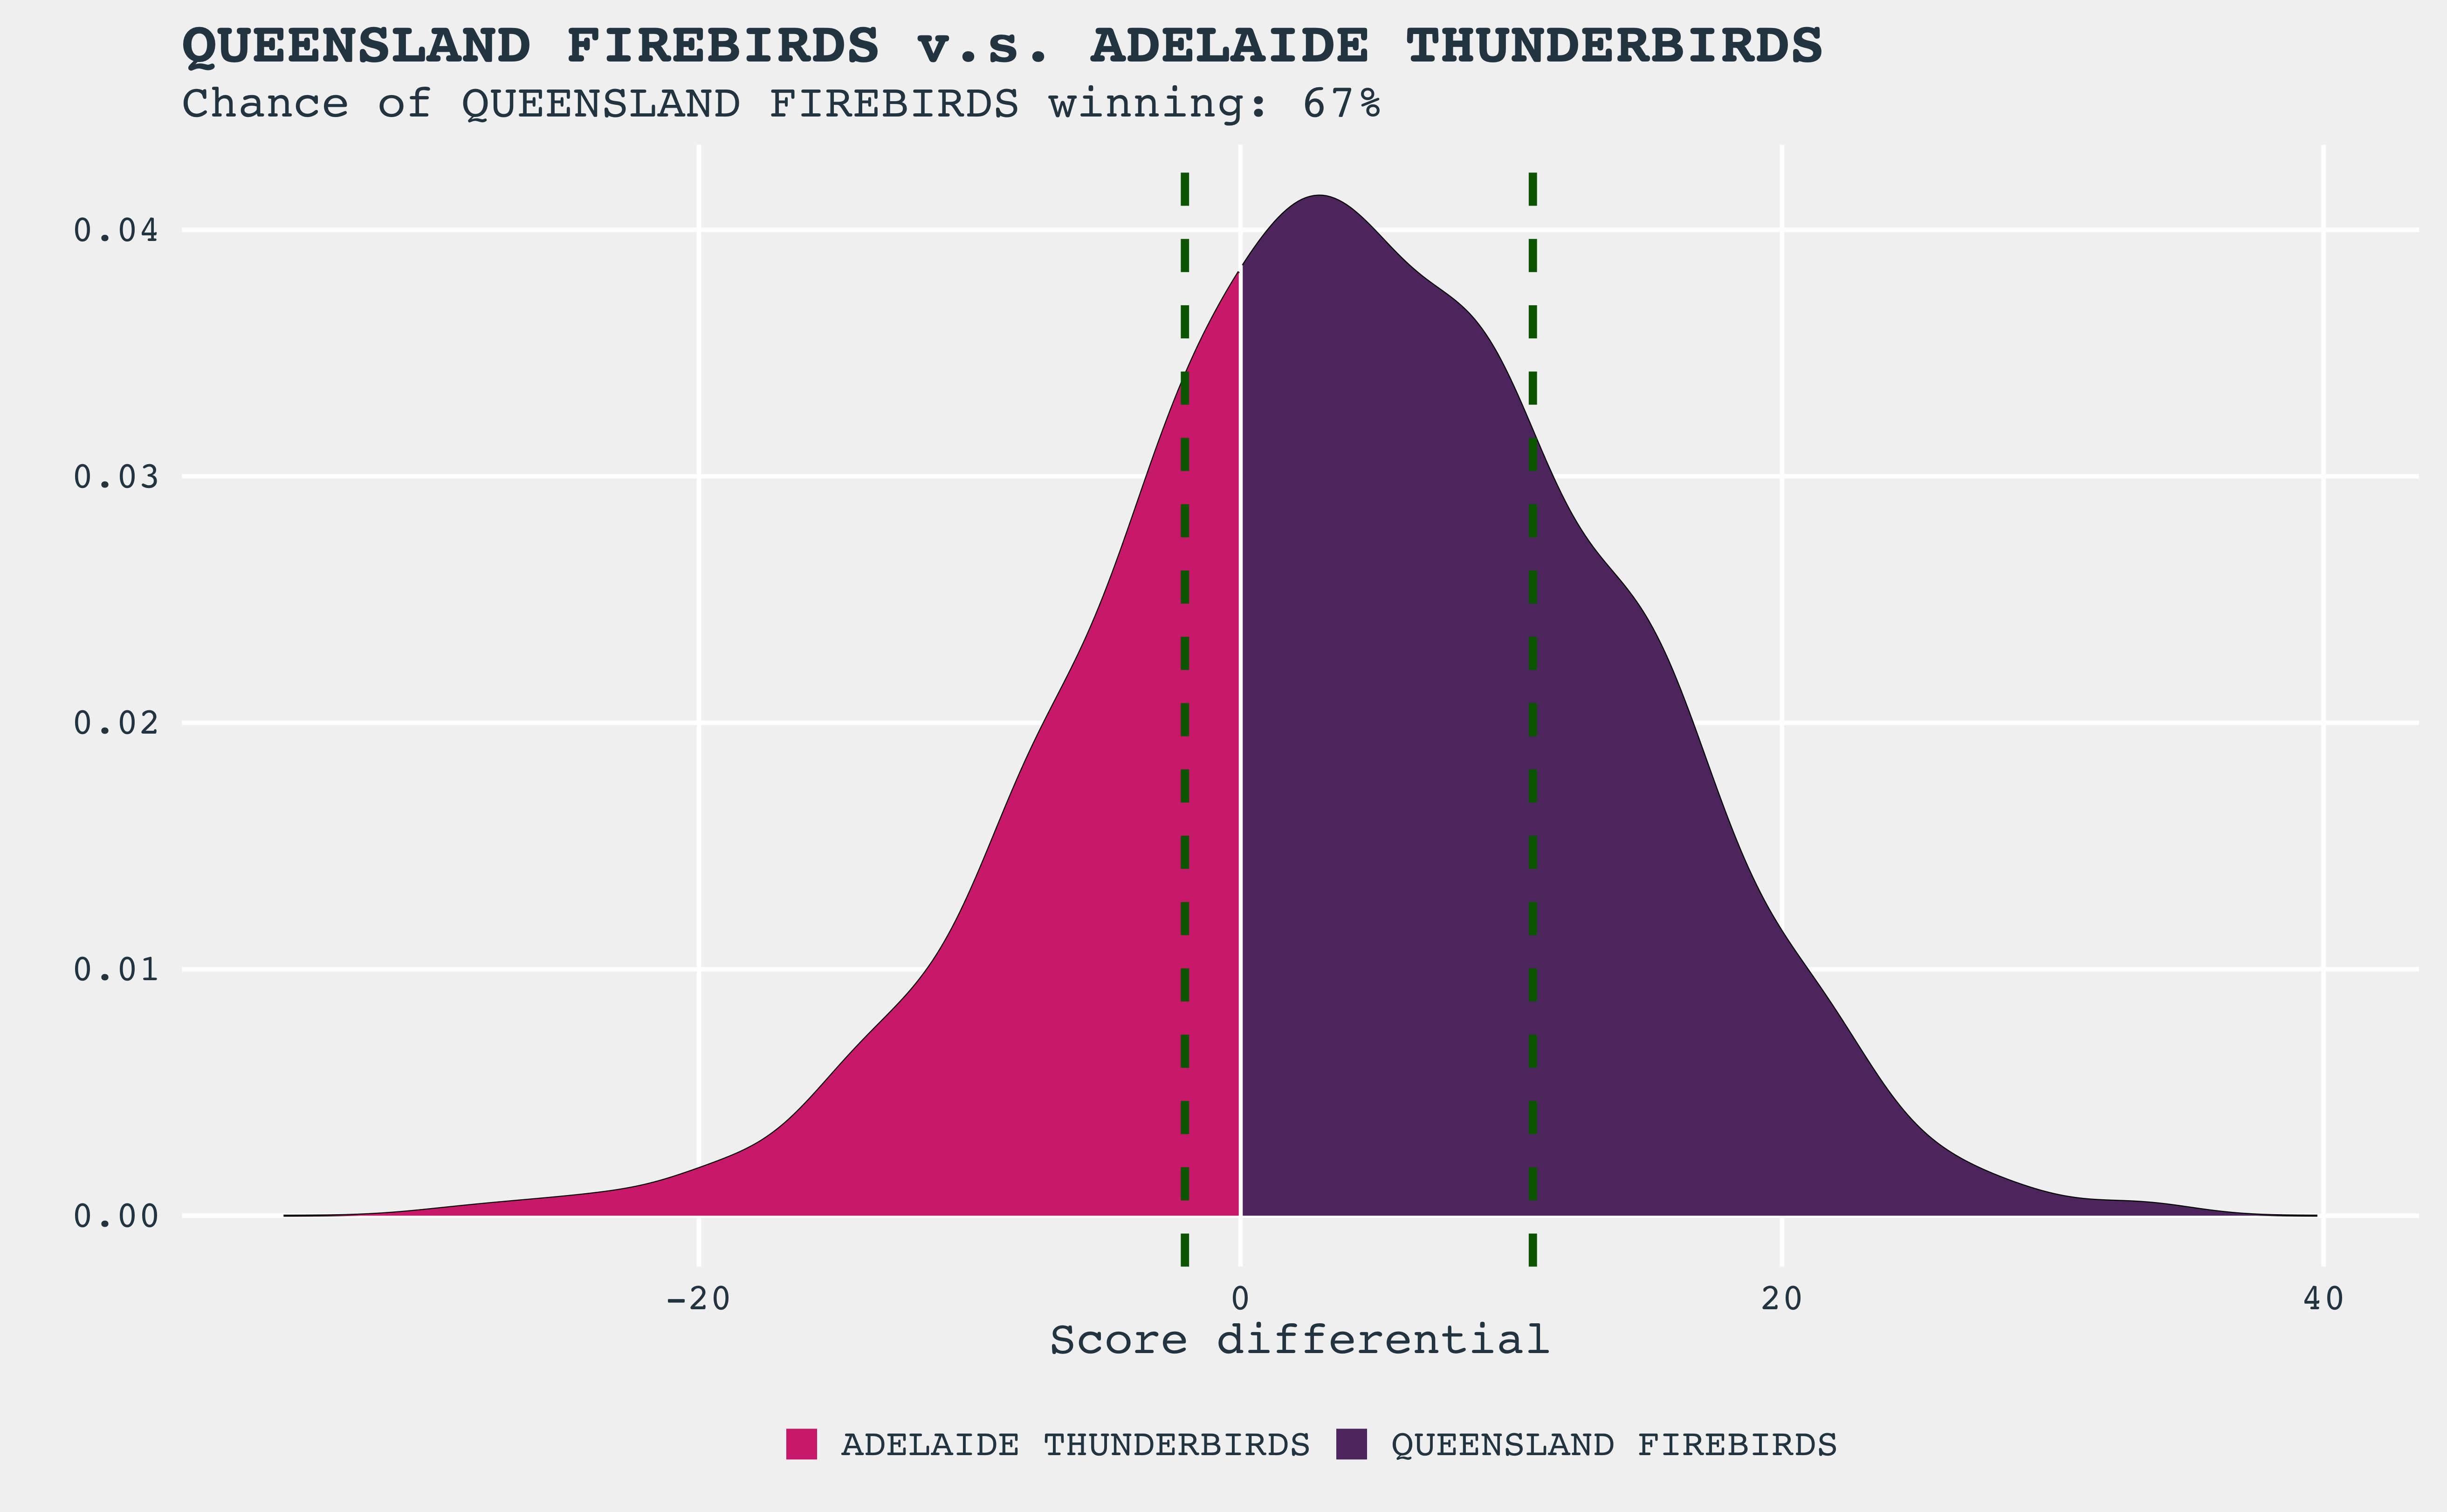
| Queensland Firebirds | Adelaide Thunderbirds | 67% |
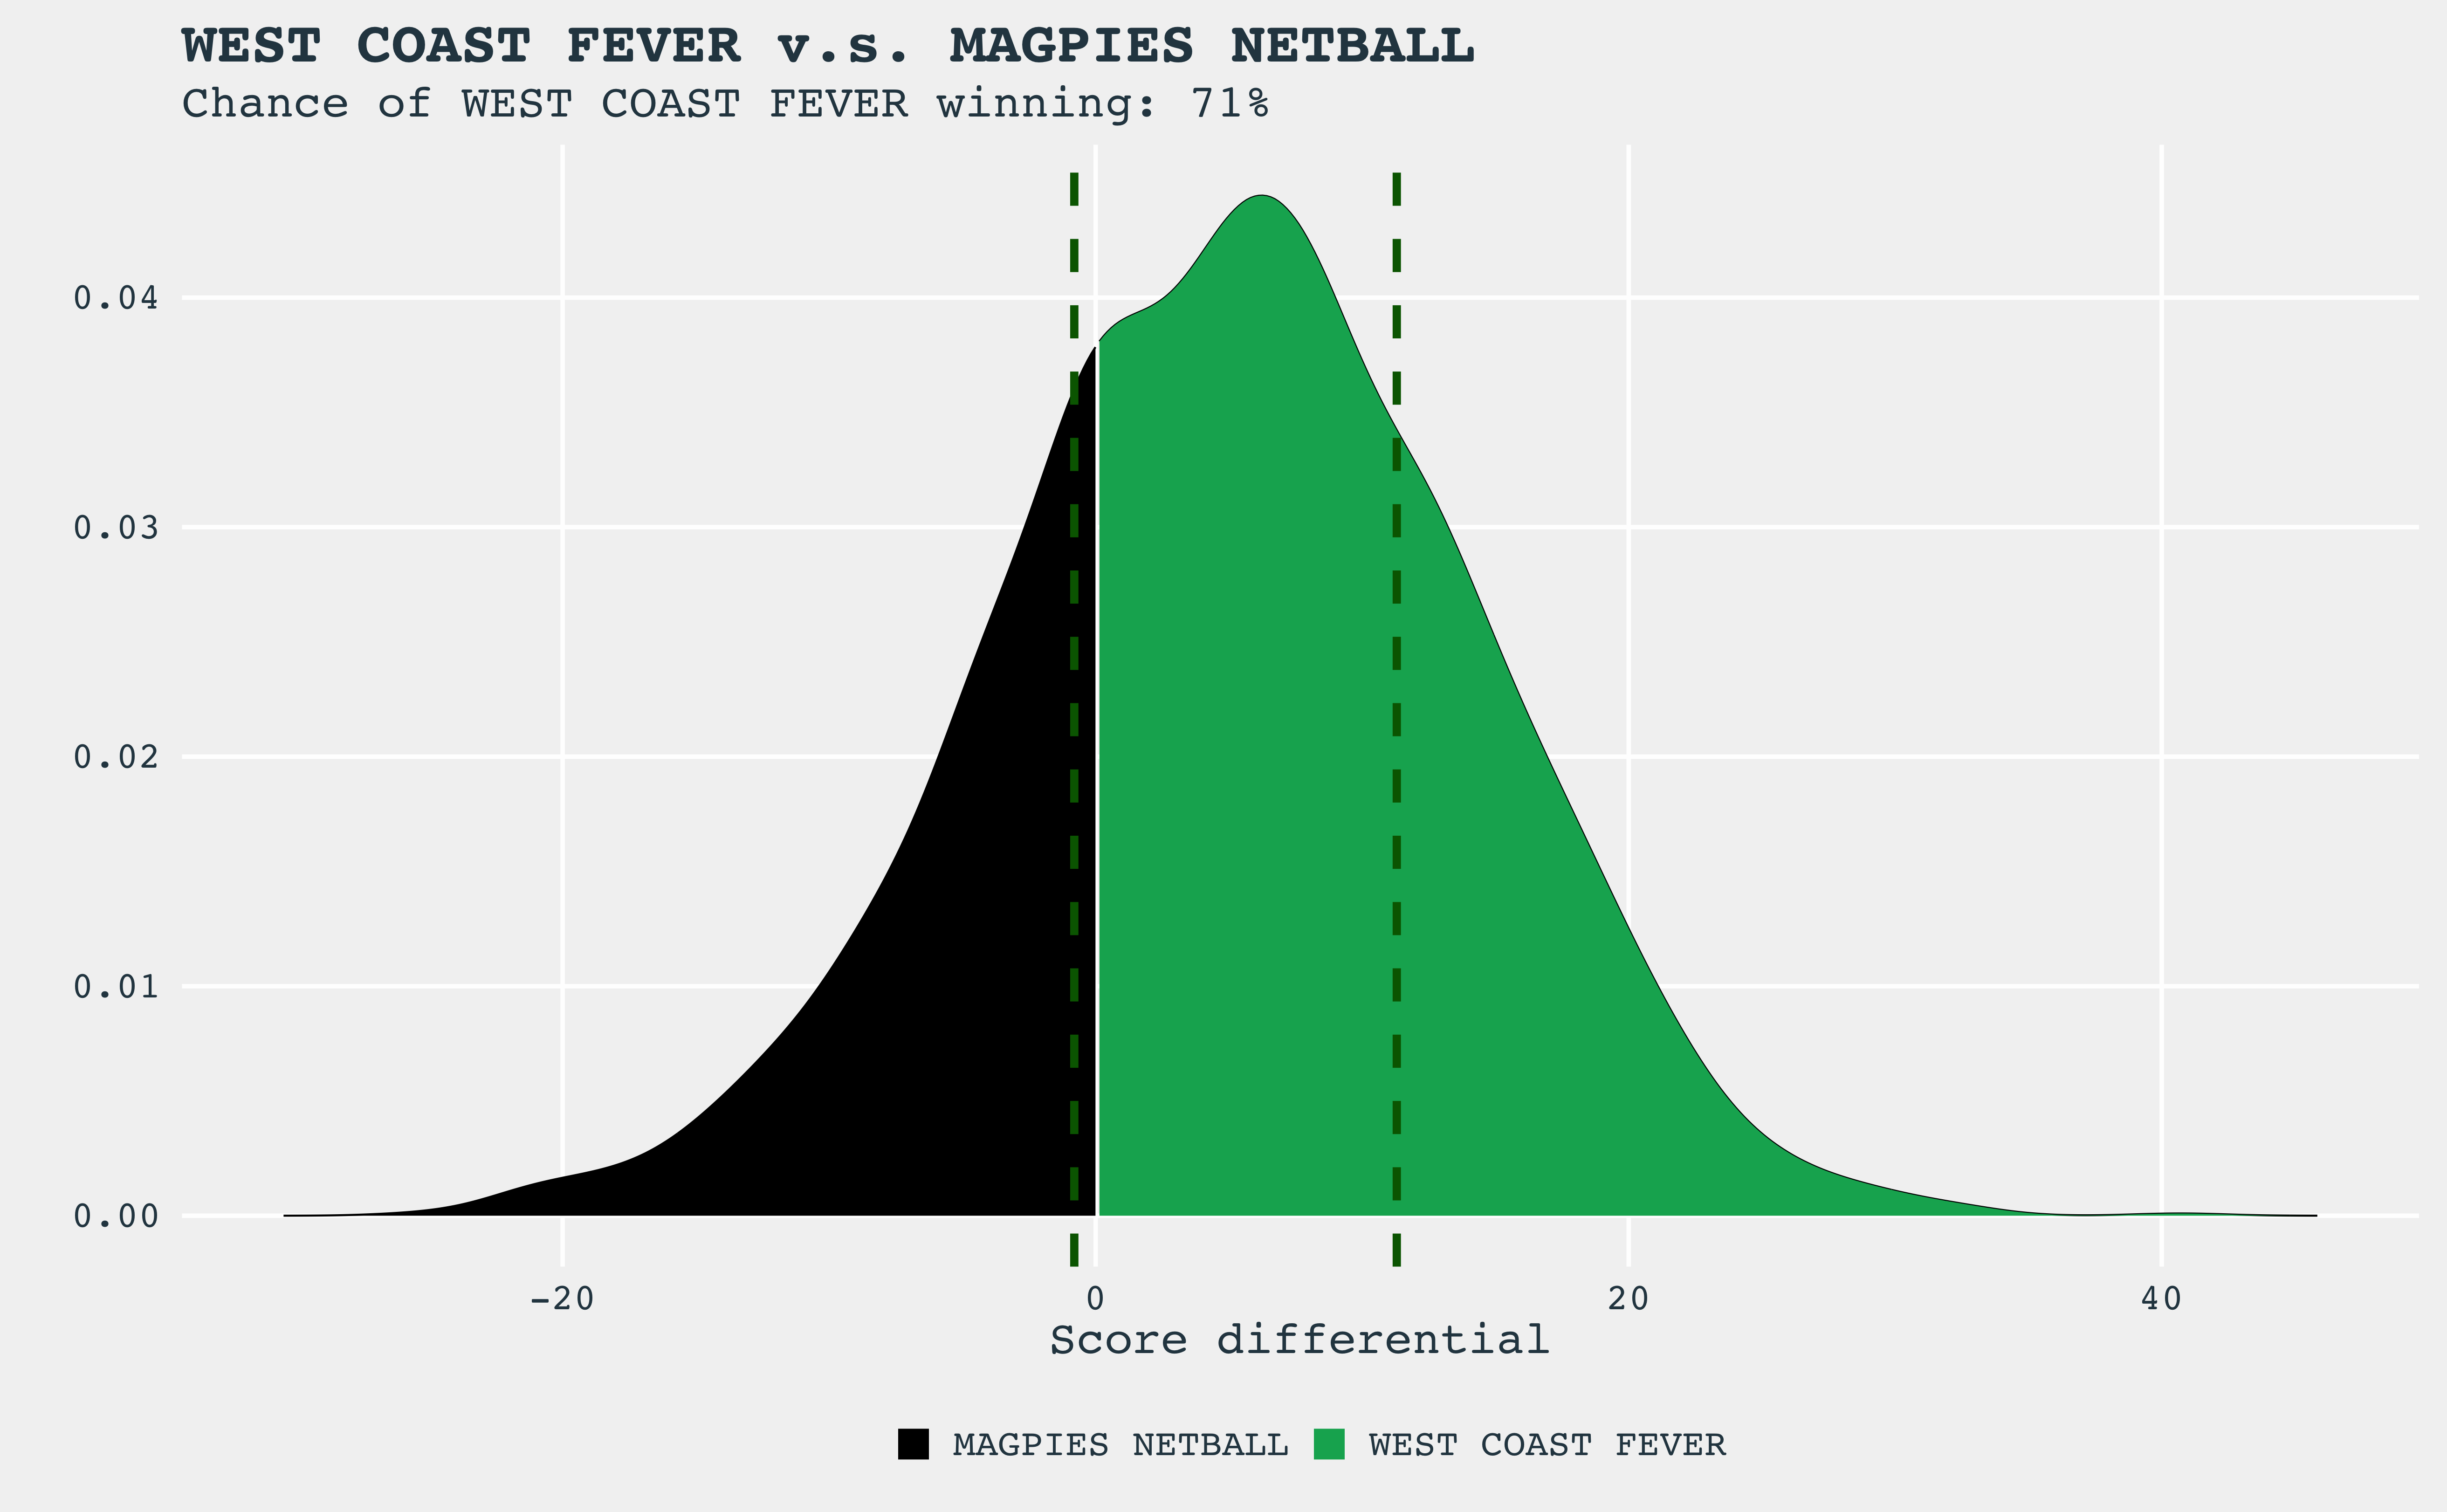
| West Coast Fever | Magpies Netball | 71% |
Score Differential Distributions
The distribution of the predicted score differentials is shown in the figures below. For each game, the chance of the home team winning is calculated and shown in the figure title. Each distribution is coloured by the team’s colours, and the more of a single team’s colour, the higher the chance that team has of winning. Overlaid on each figure are two vertical, dashed dark green lines; these show the score differential that has a 50% predicted chance of happening.
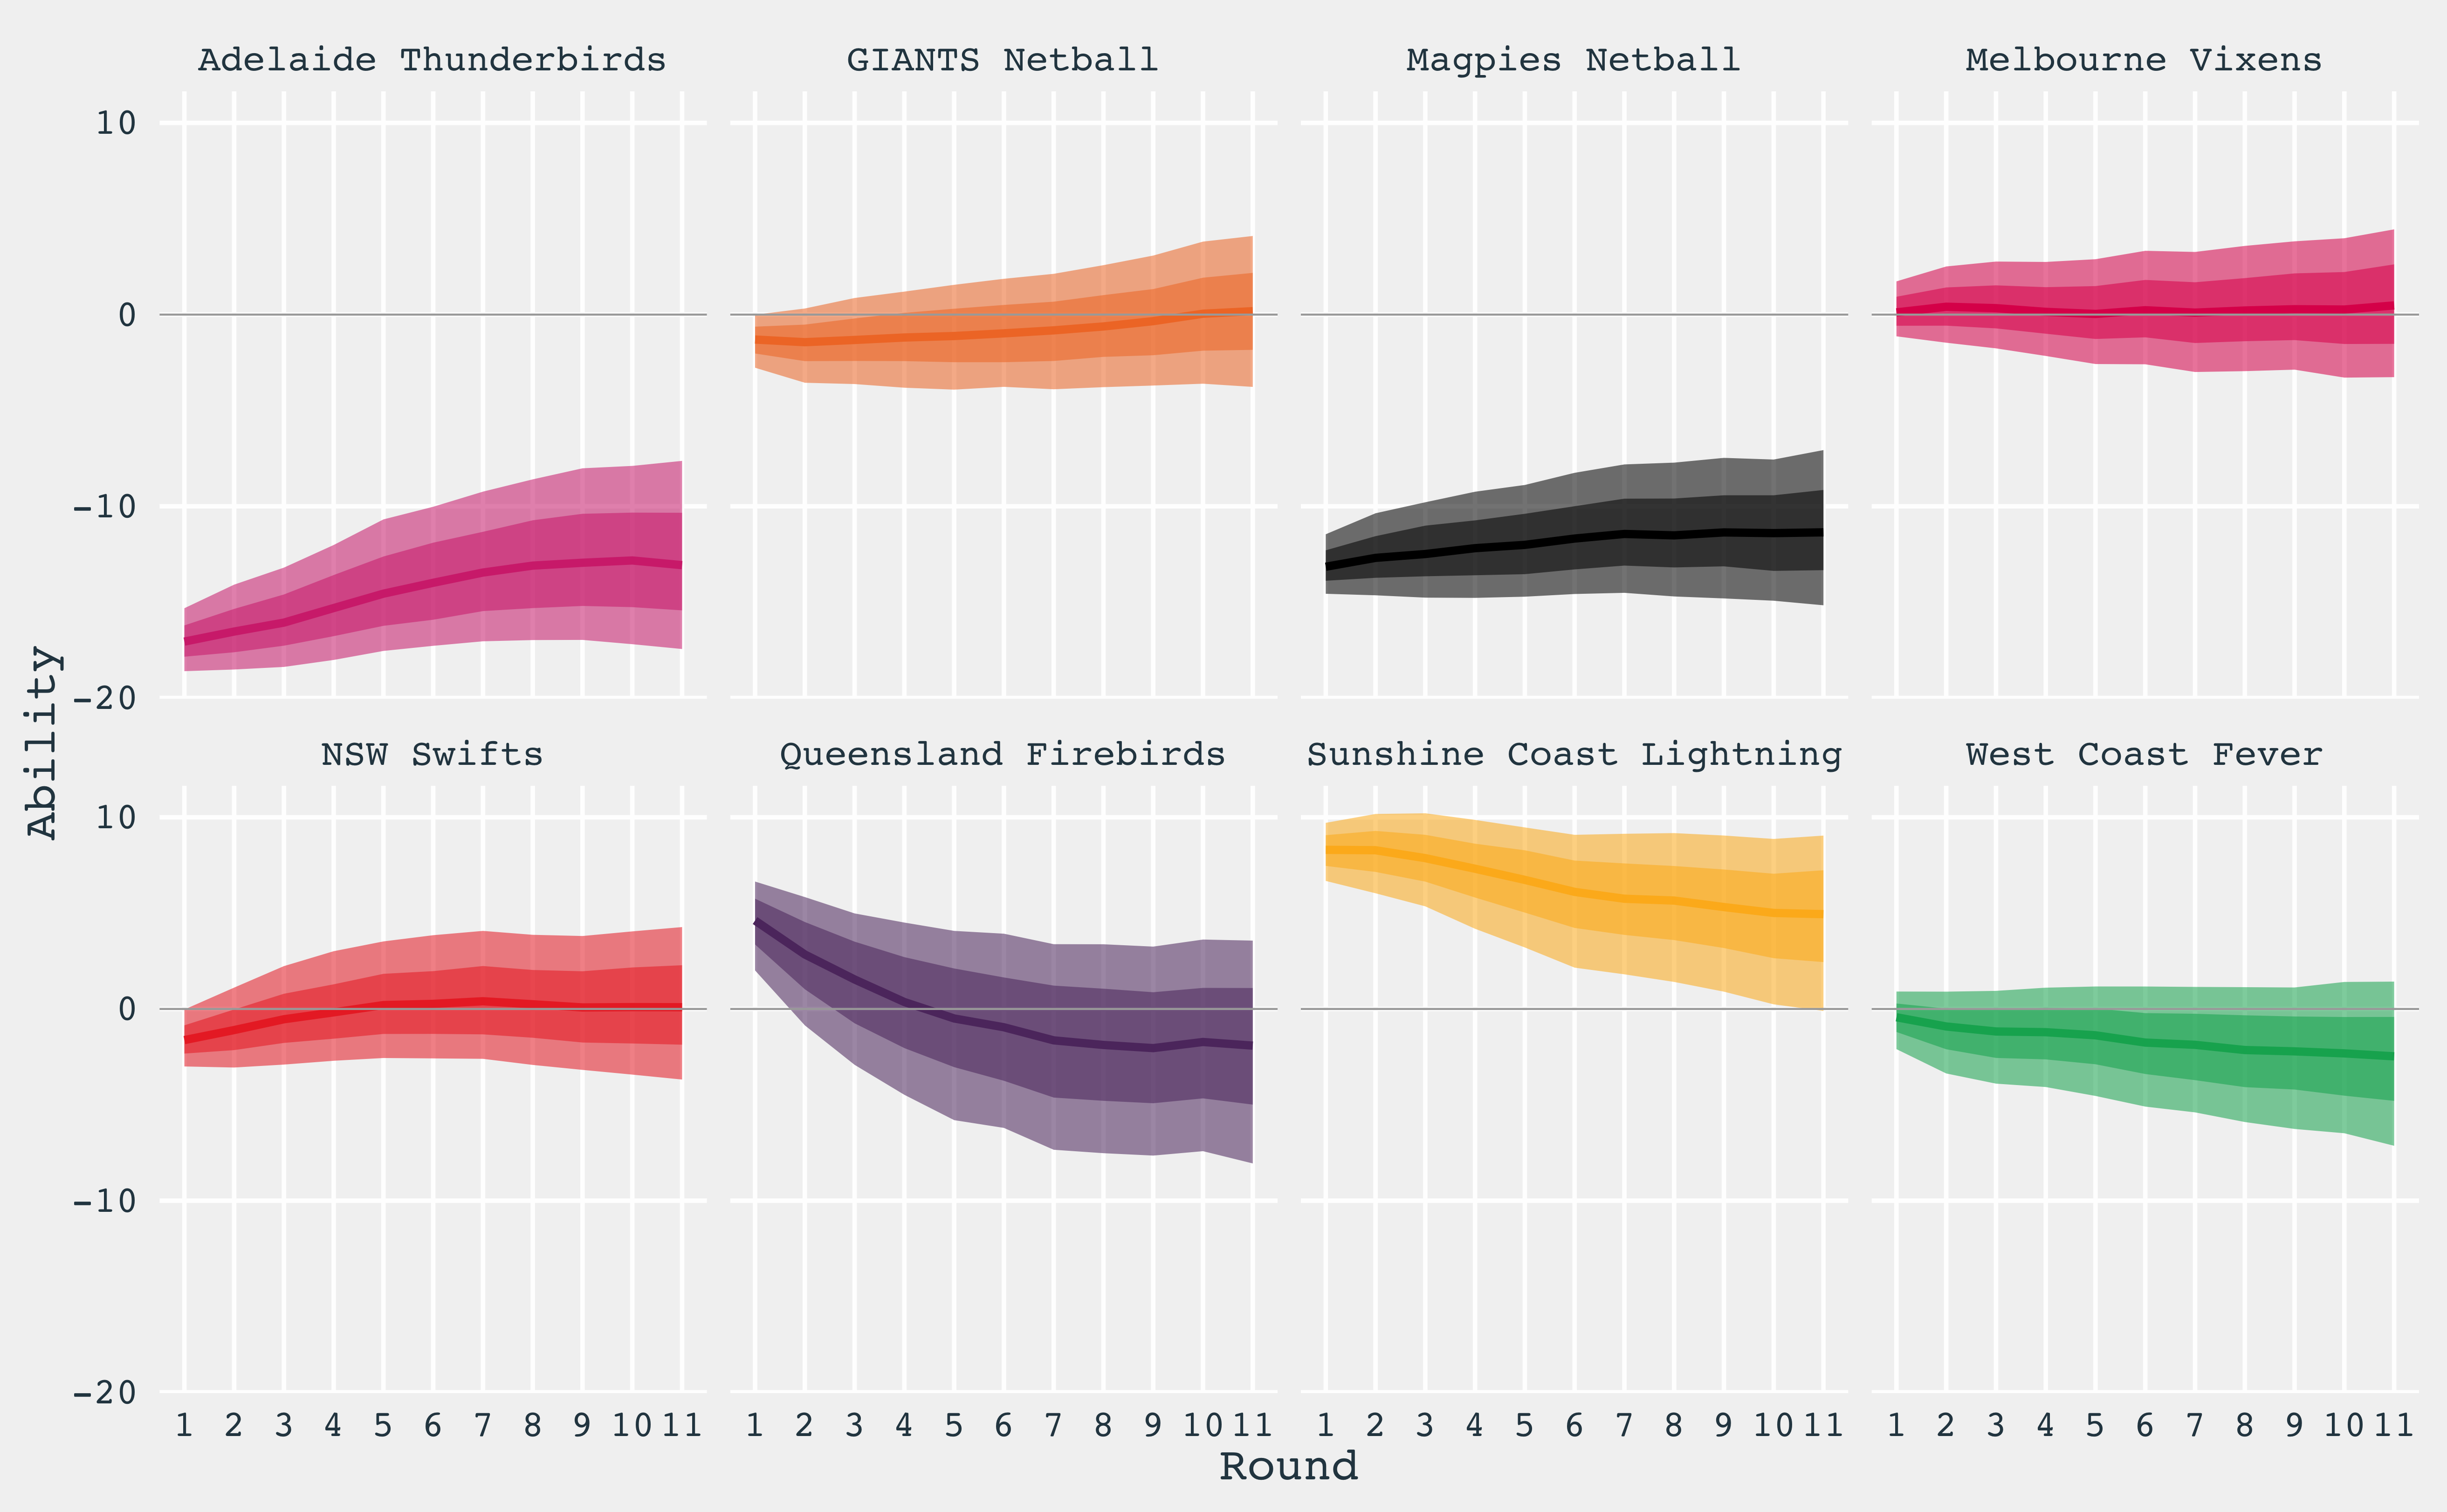
Team Abilities