Predictions for round 3 are given in the table below. Given the way the teams have played, I still don’t quite trust that the model has calibrated yet. I would have thought that the Vixens and Swifts would be red hot favourites. Check out the predicted team abilities below; they basically haven’t changed, whereas last year they bumped around quite a lot. See below for some thoughts.
| Home | Away | Chance of home team winning |
|---|---|---|
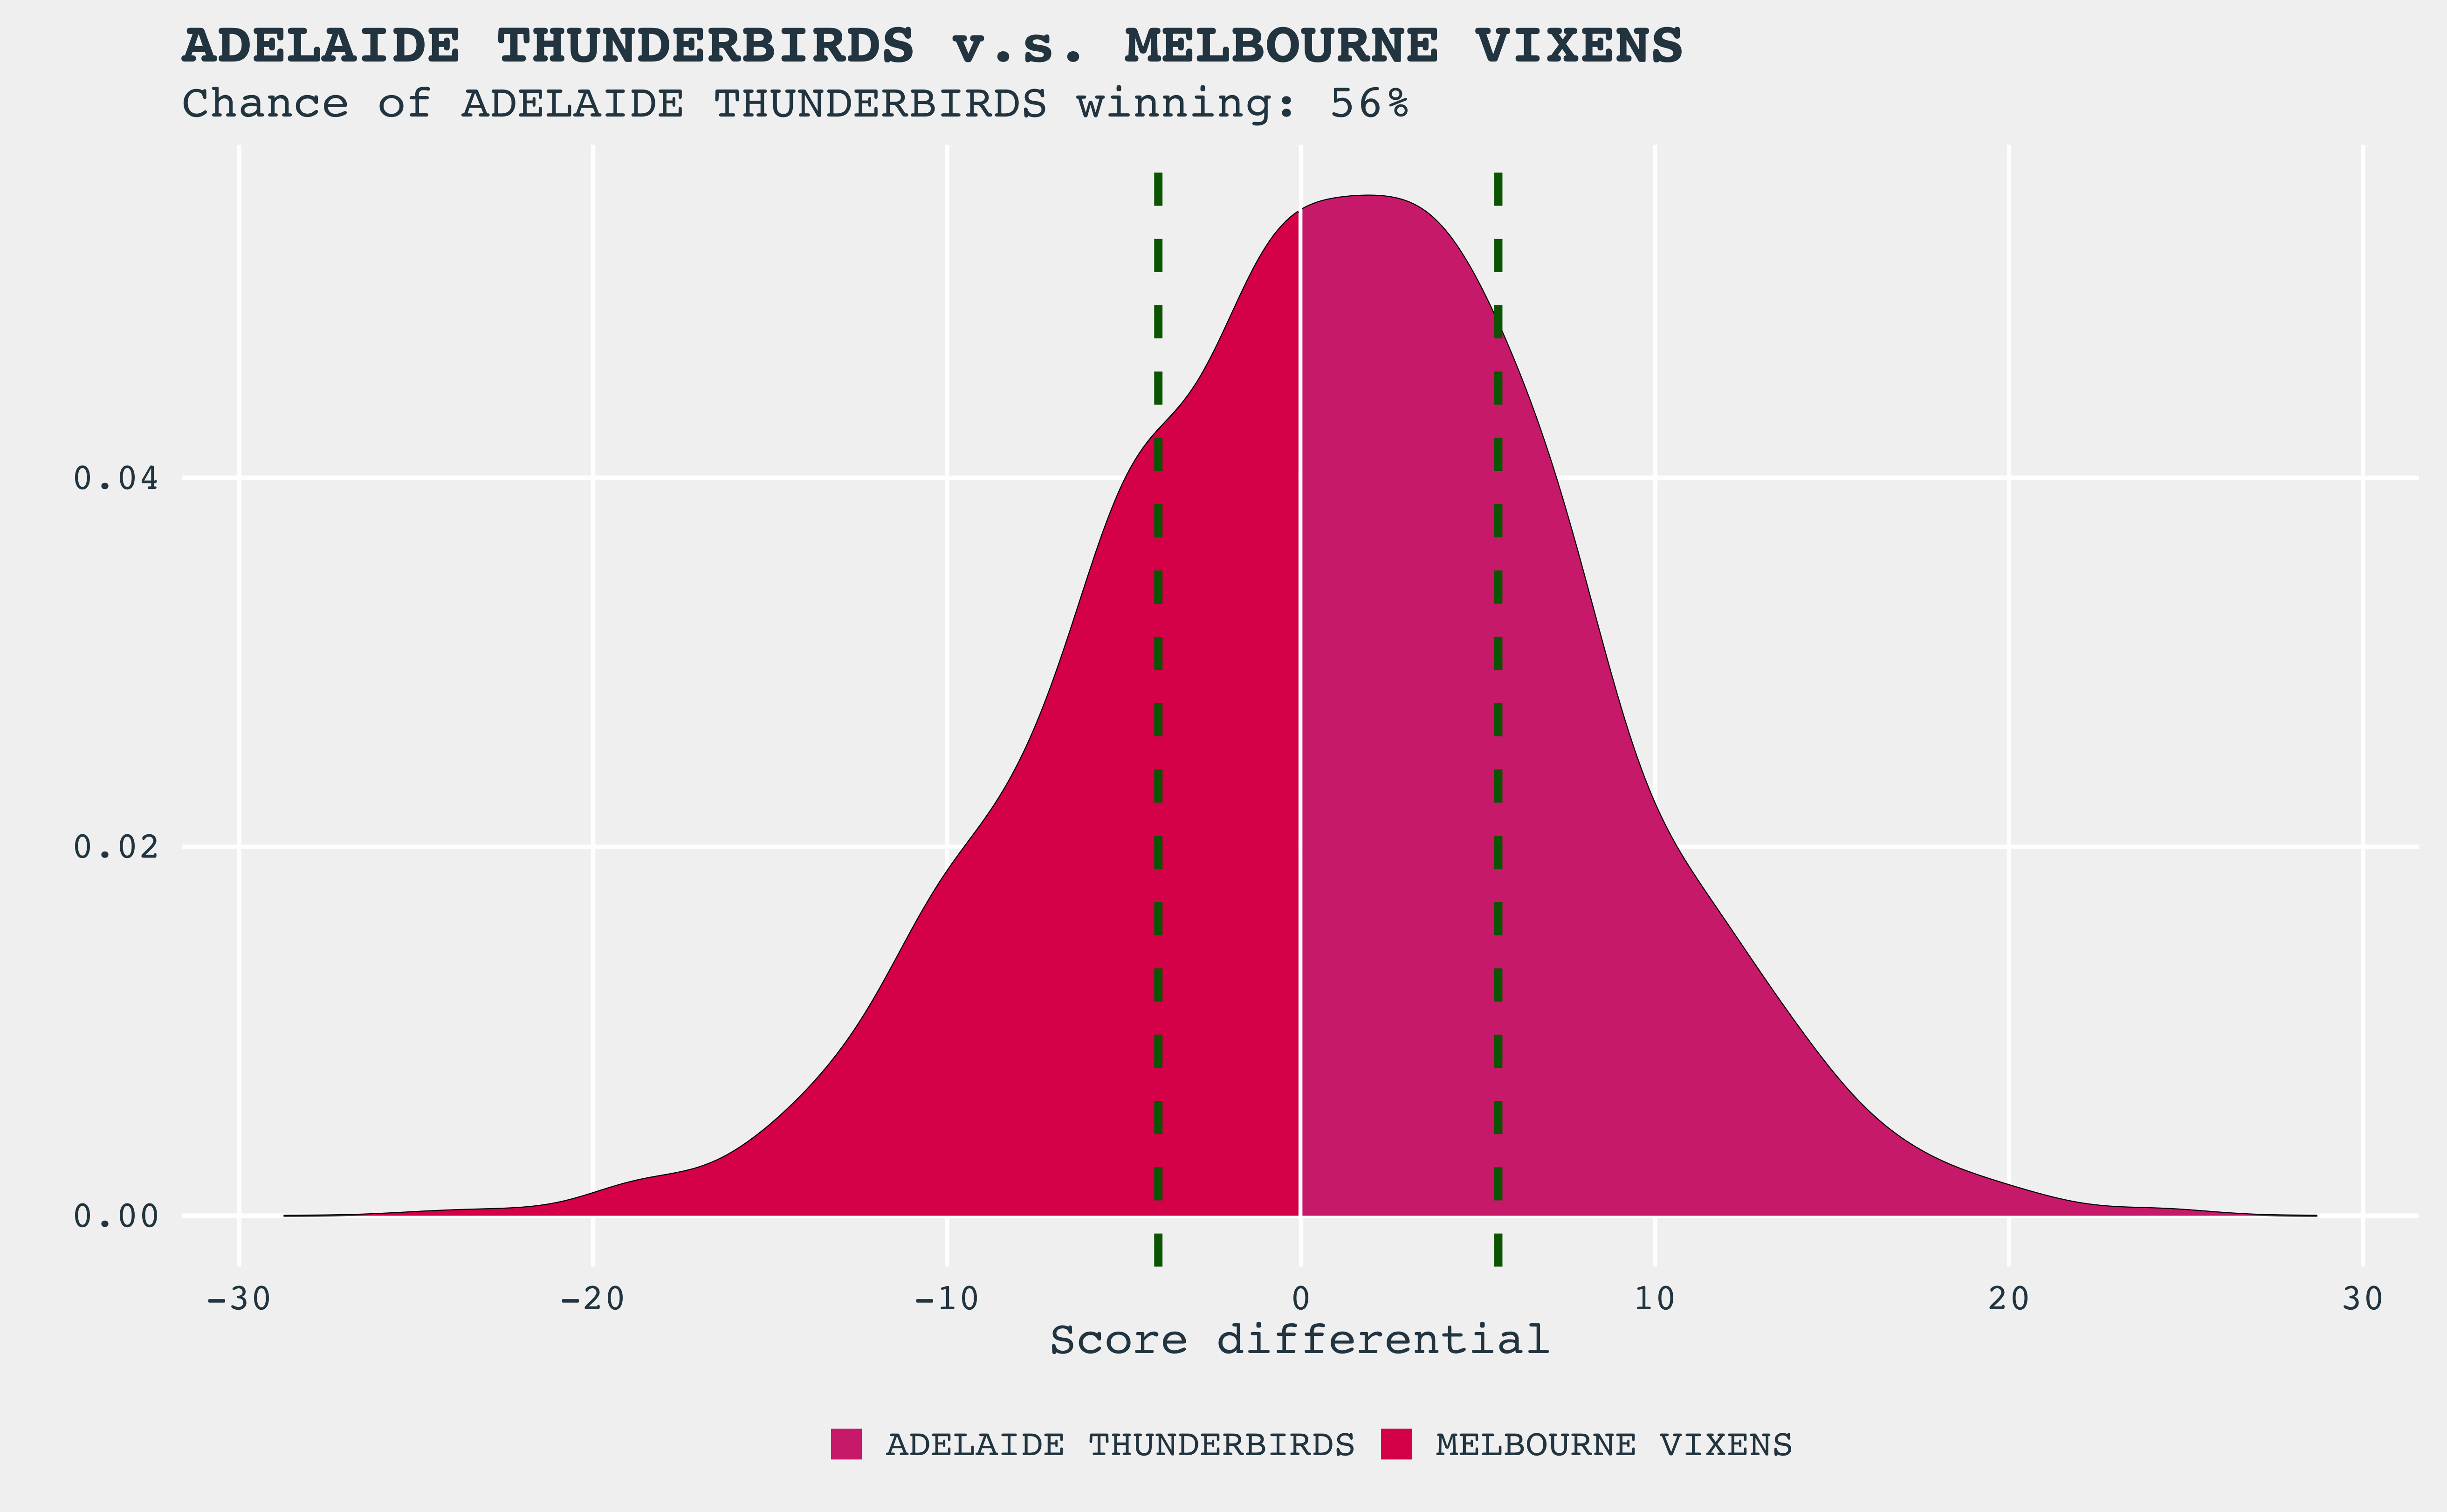
| Adelaide Thunderbirds | Melbourne Vixens | 56% |
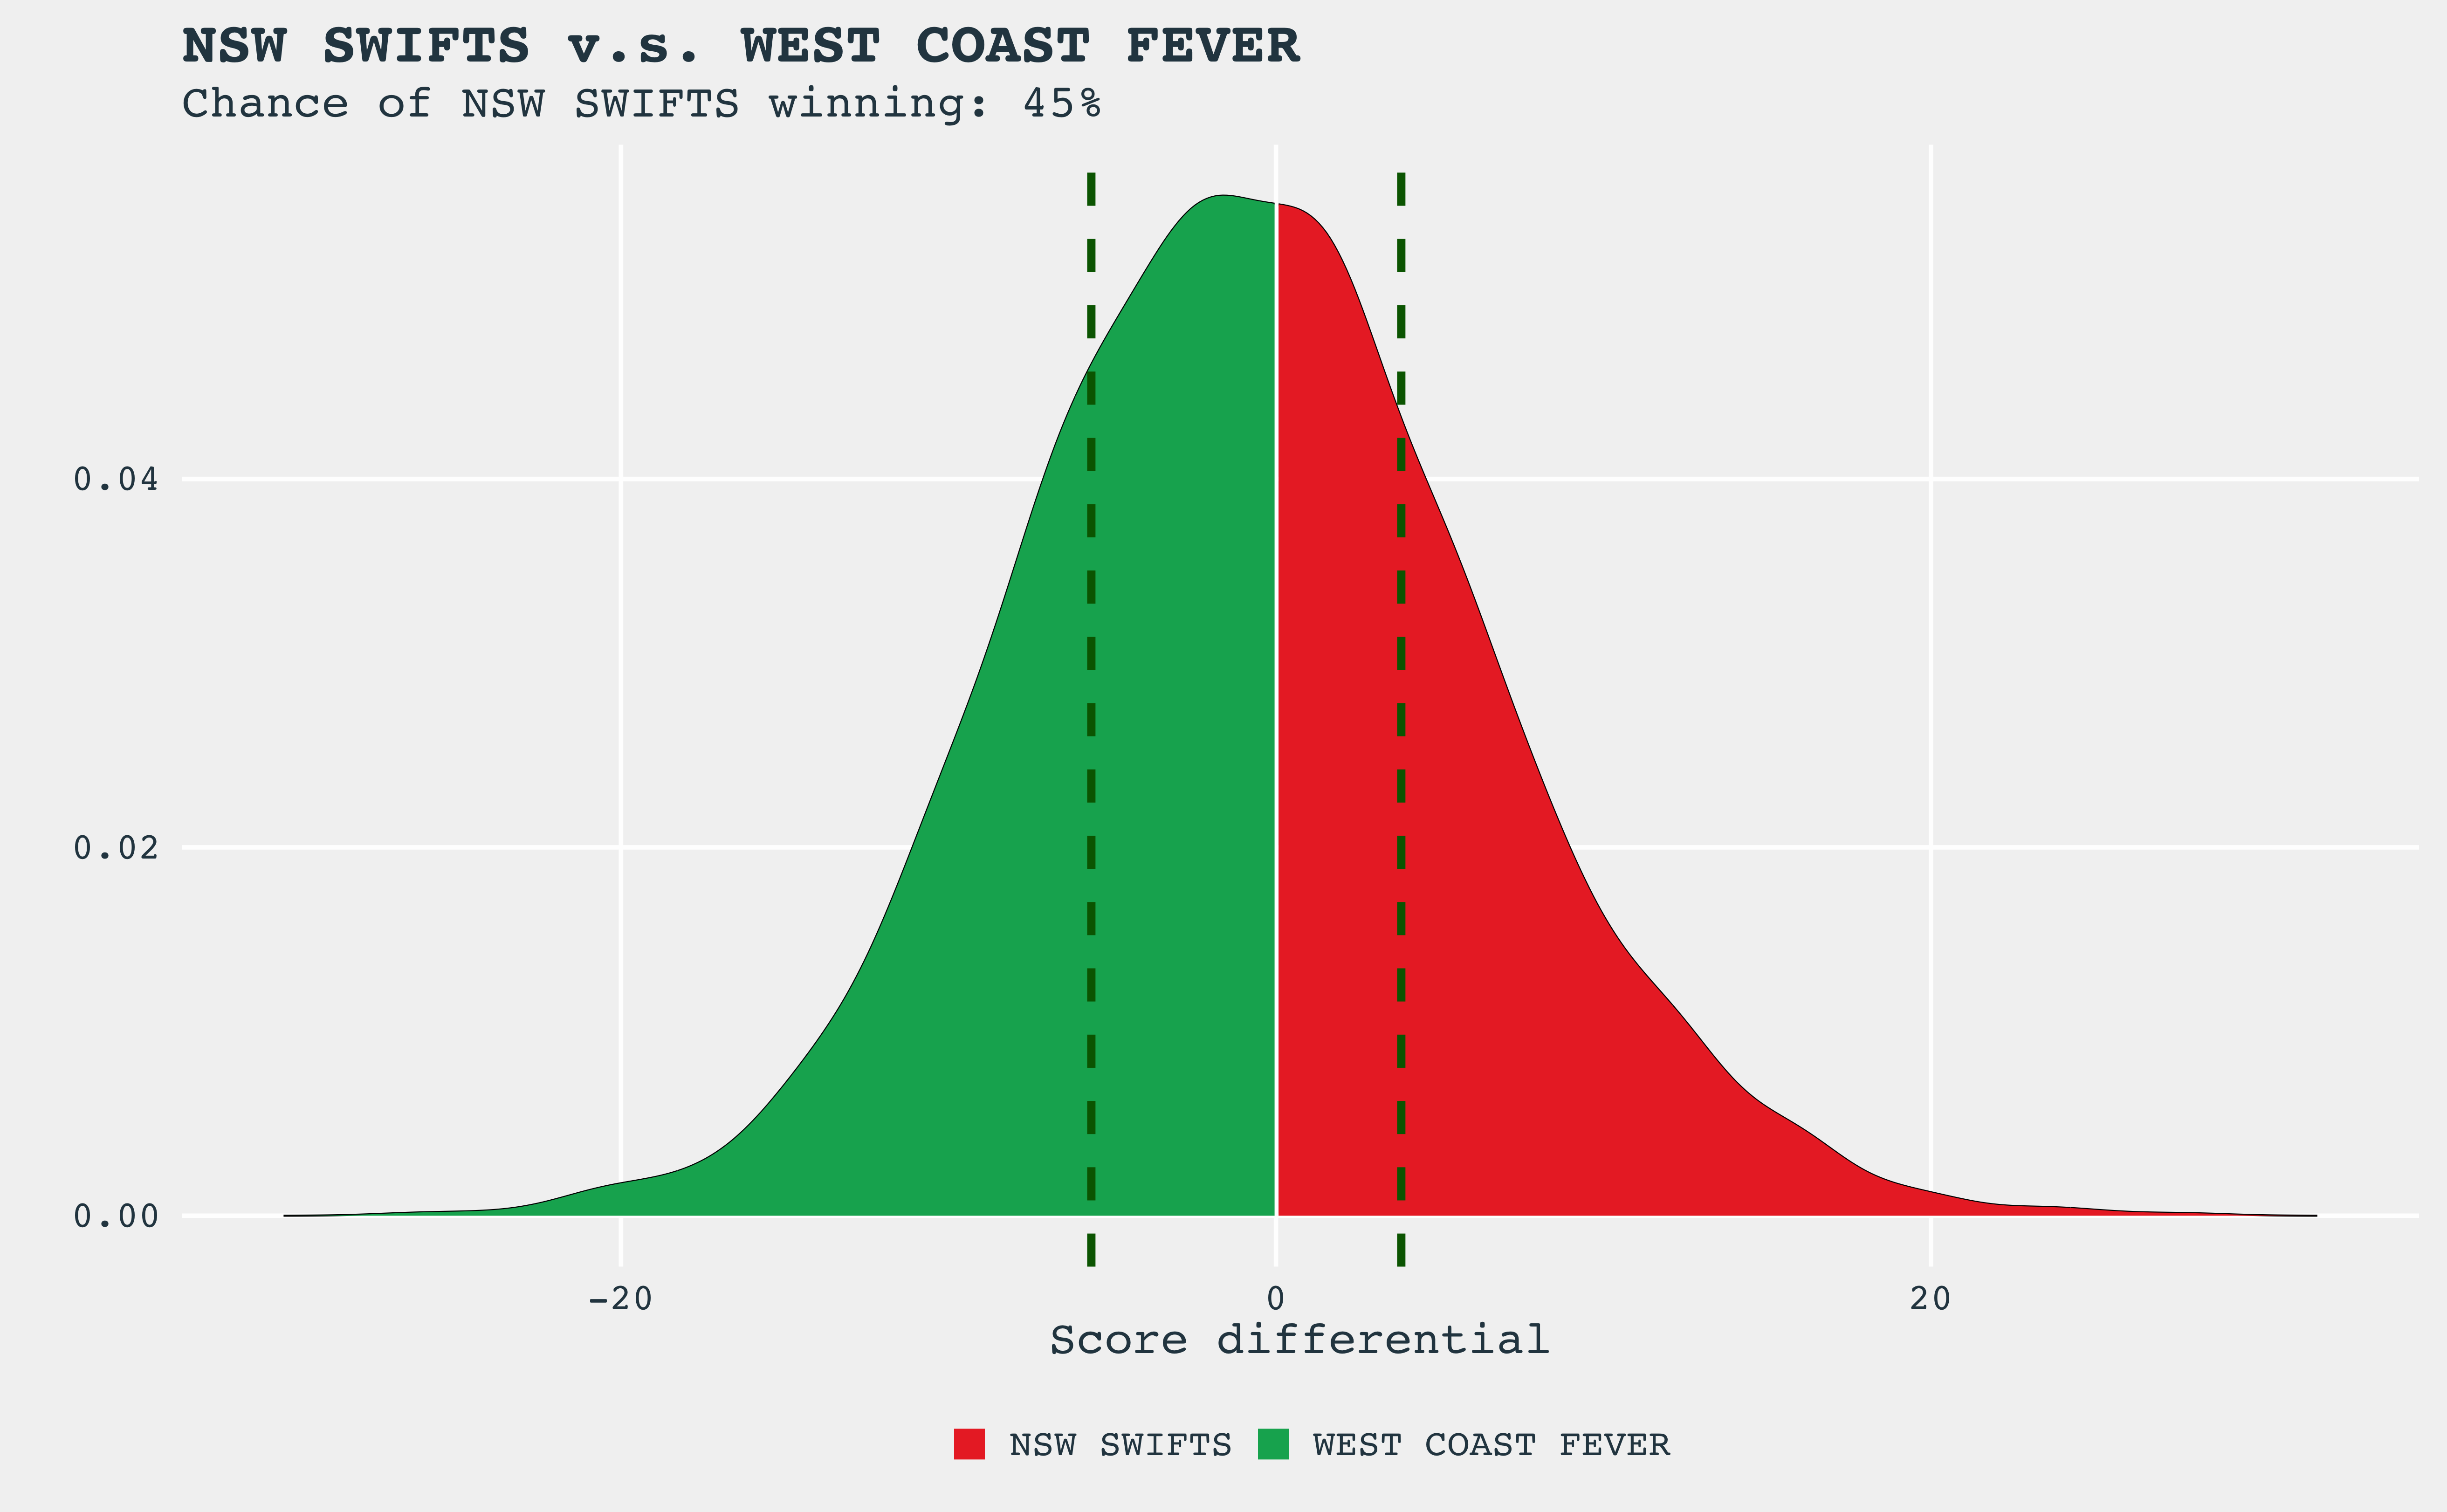
| NSW Swifts | West Coast Fever | 45% |
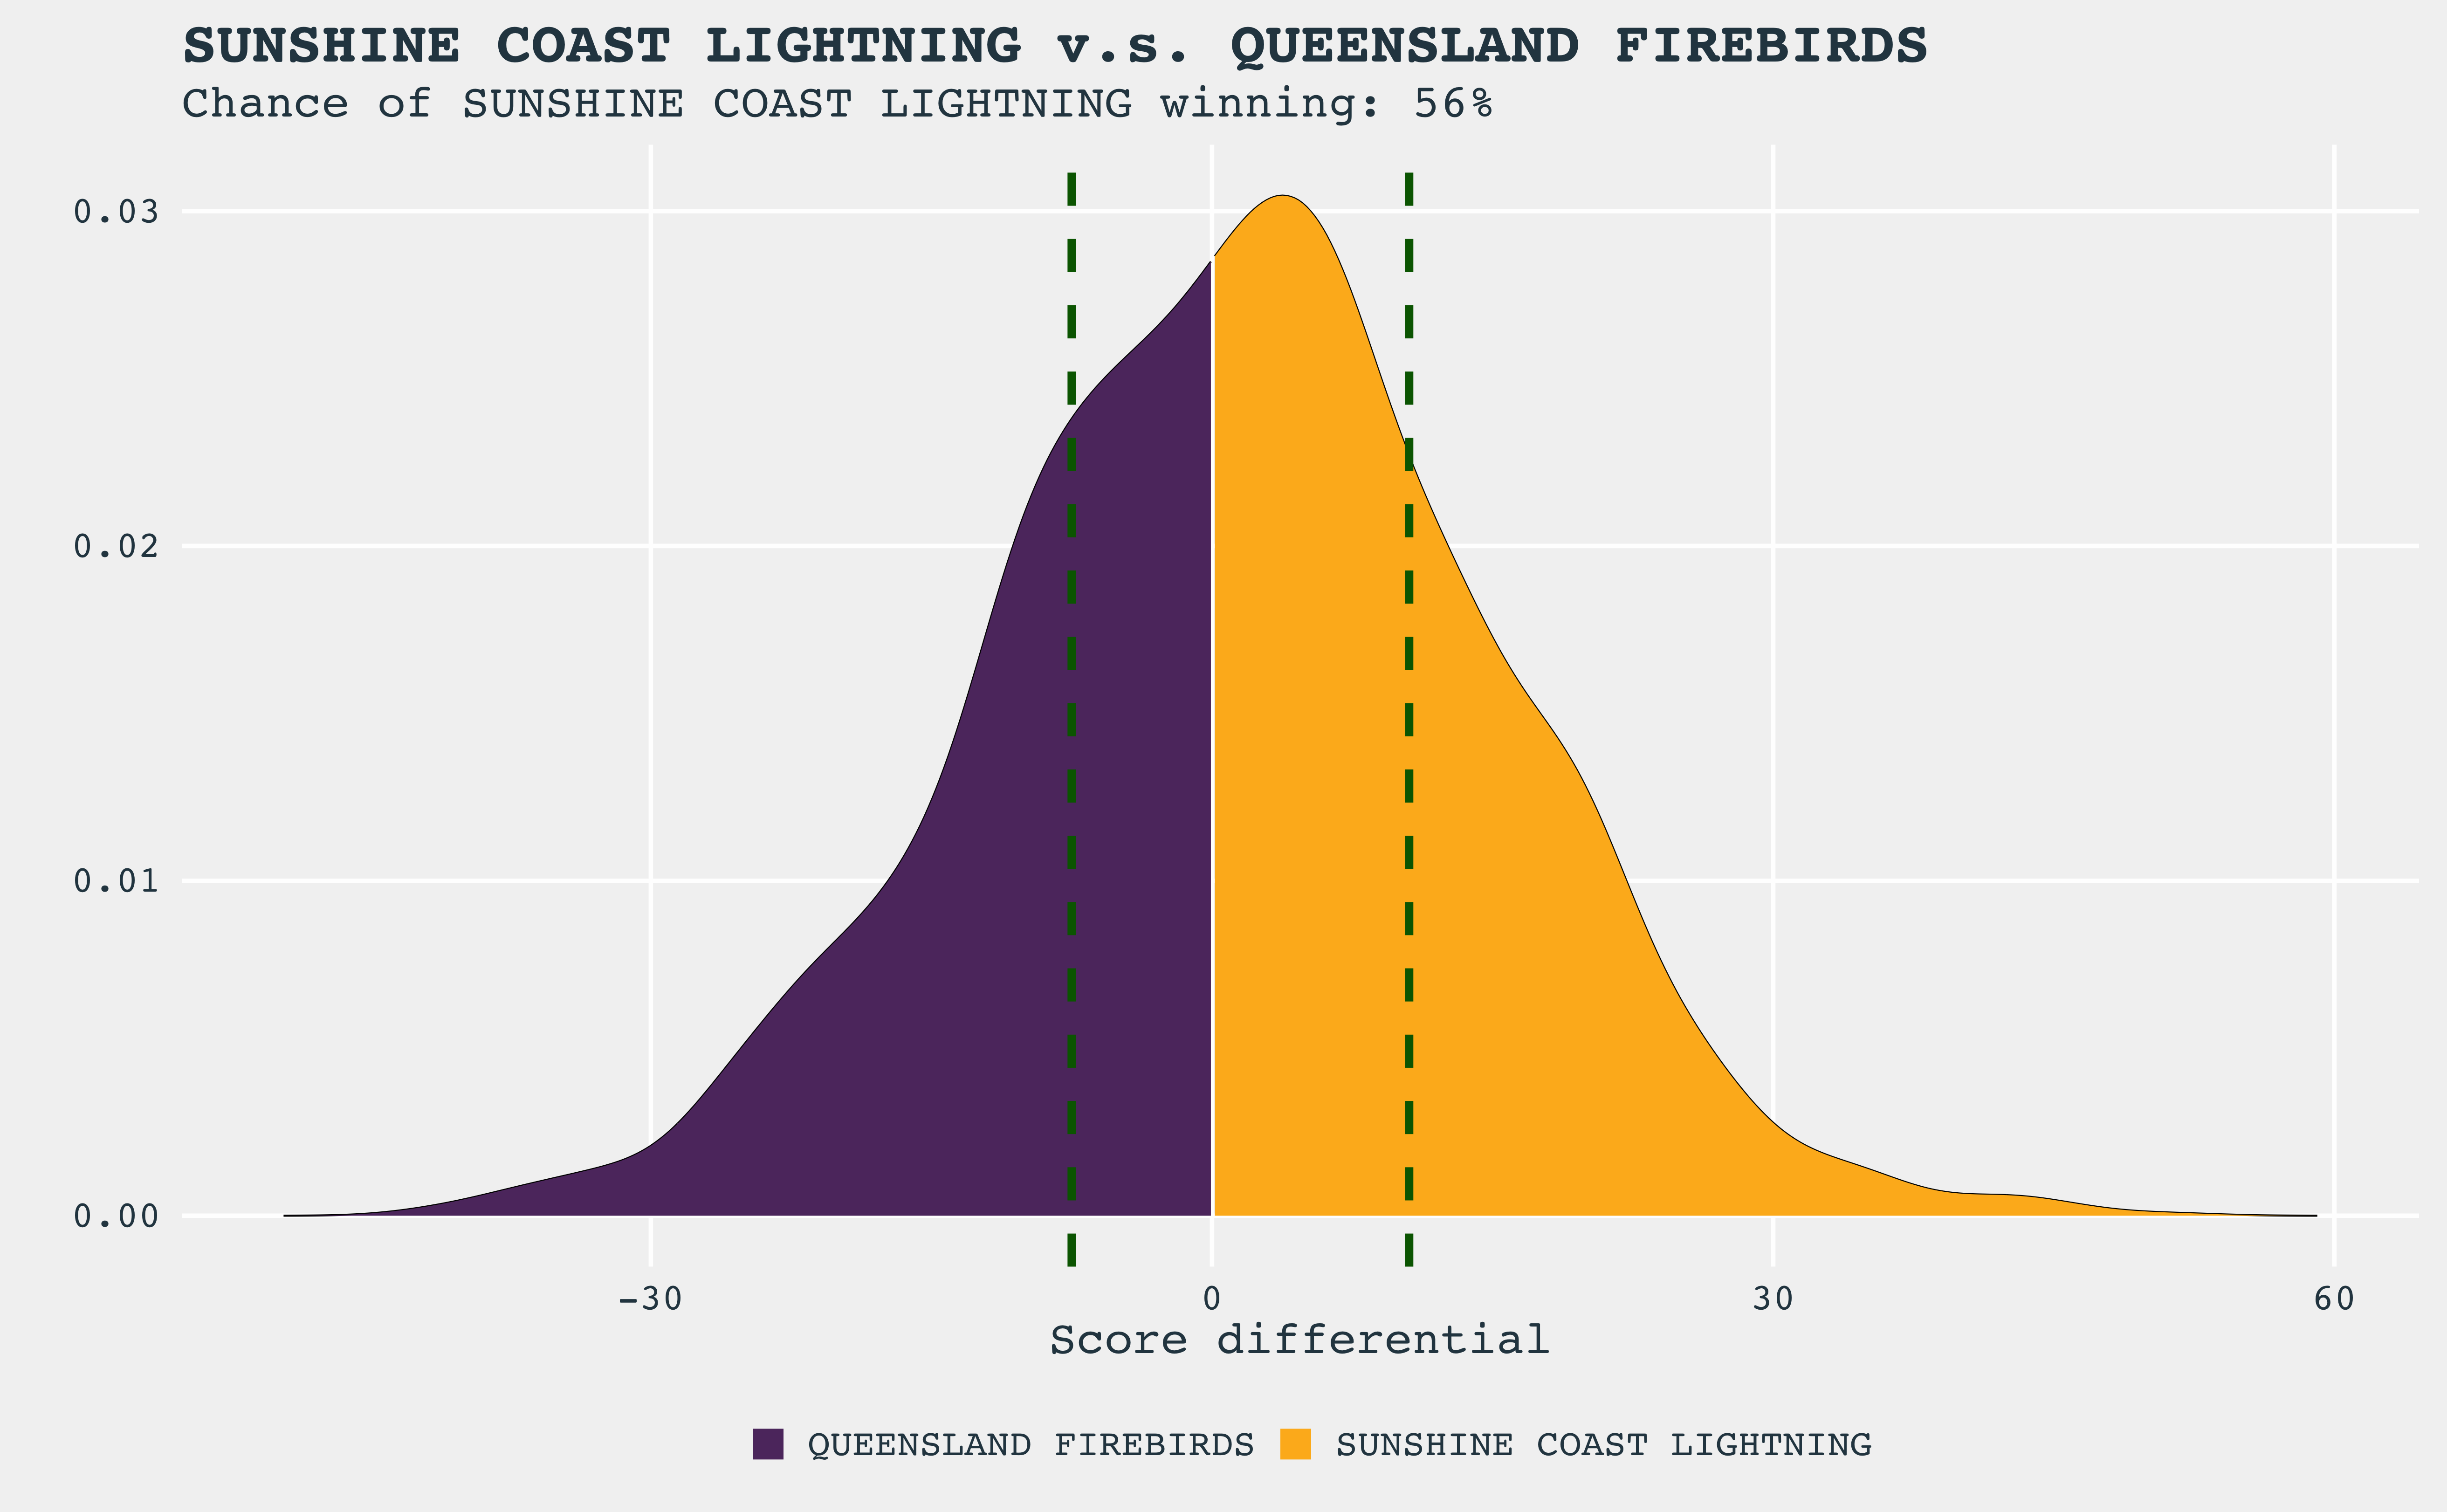
| Sunshine Coast Lightning | Queensland Firebirds | 56% |
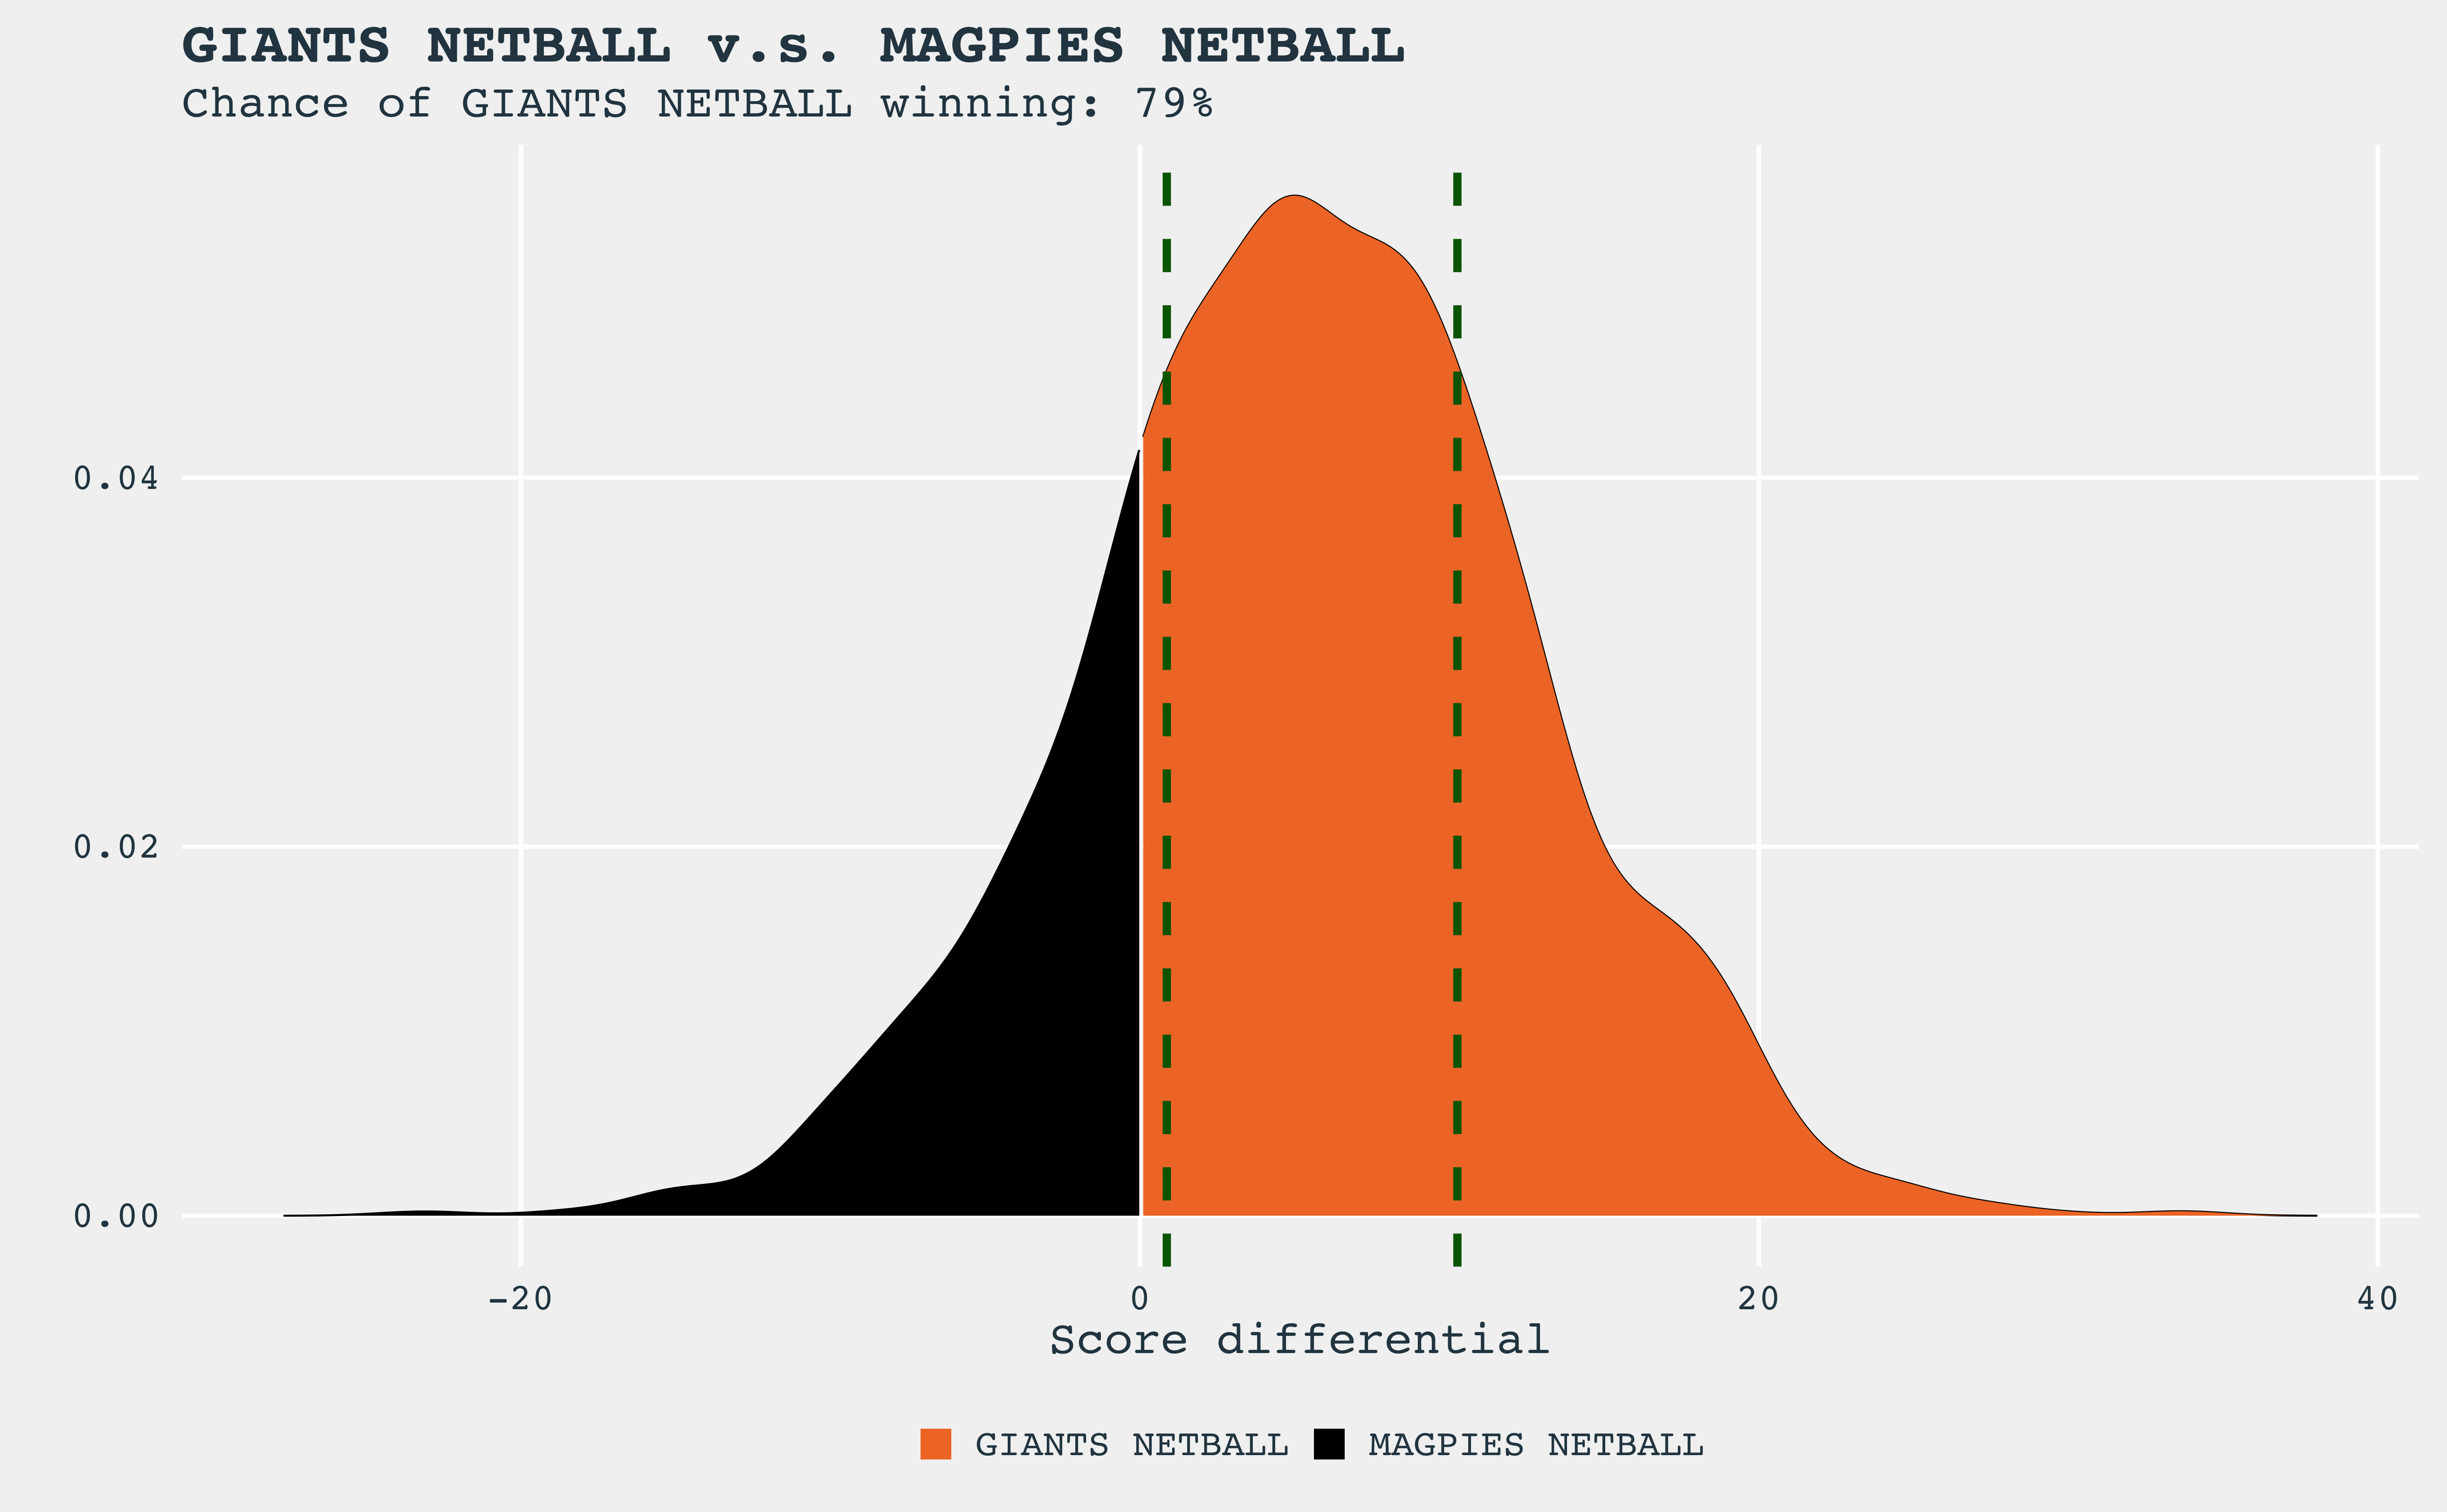
| GIANTS Netball | Magpies Netball | 79% |
Score Differential Distributions
The distribution of the predicted score differentials is shown in the figures below. For each game, the chance of the home team winning is calculated and shown in the figure title. Each distribution is coloured by the team’s colours, and the more of a single team’s colour, the higher the chance that team has of winning. Overlaid on each figure are two vertical, dashed dark green lines; these show the score differential that has a 50% predicted chance of happening.
Team Abilities
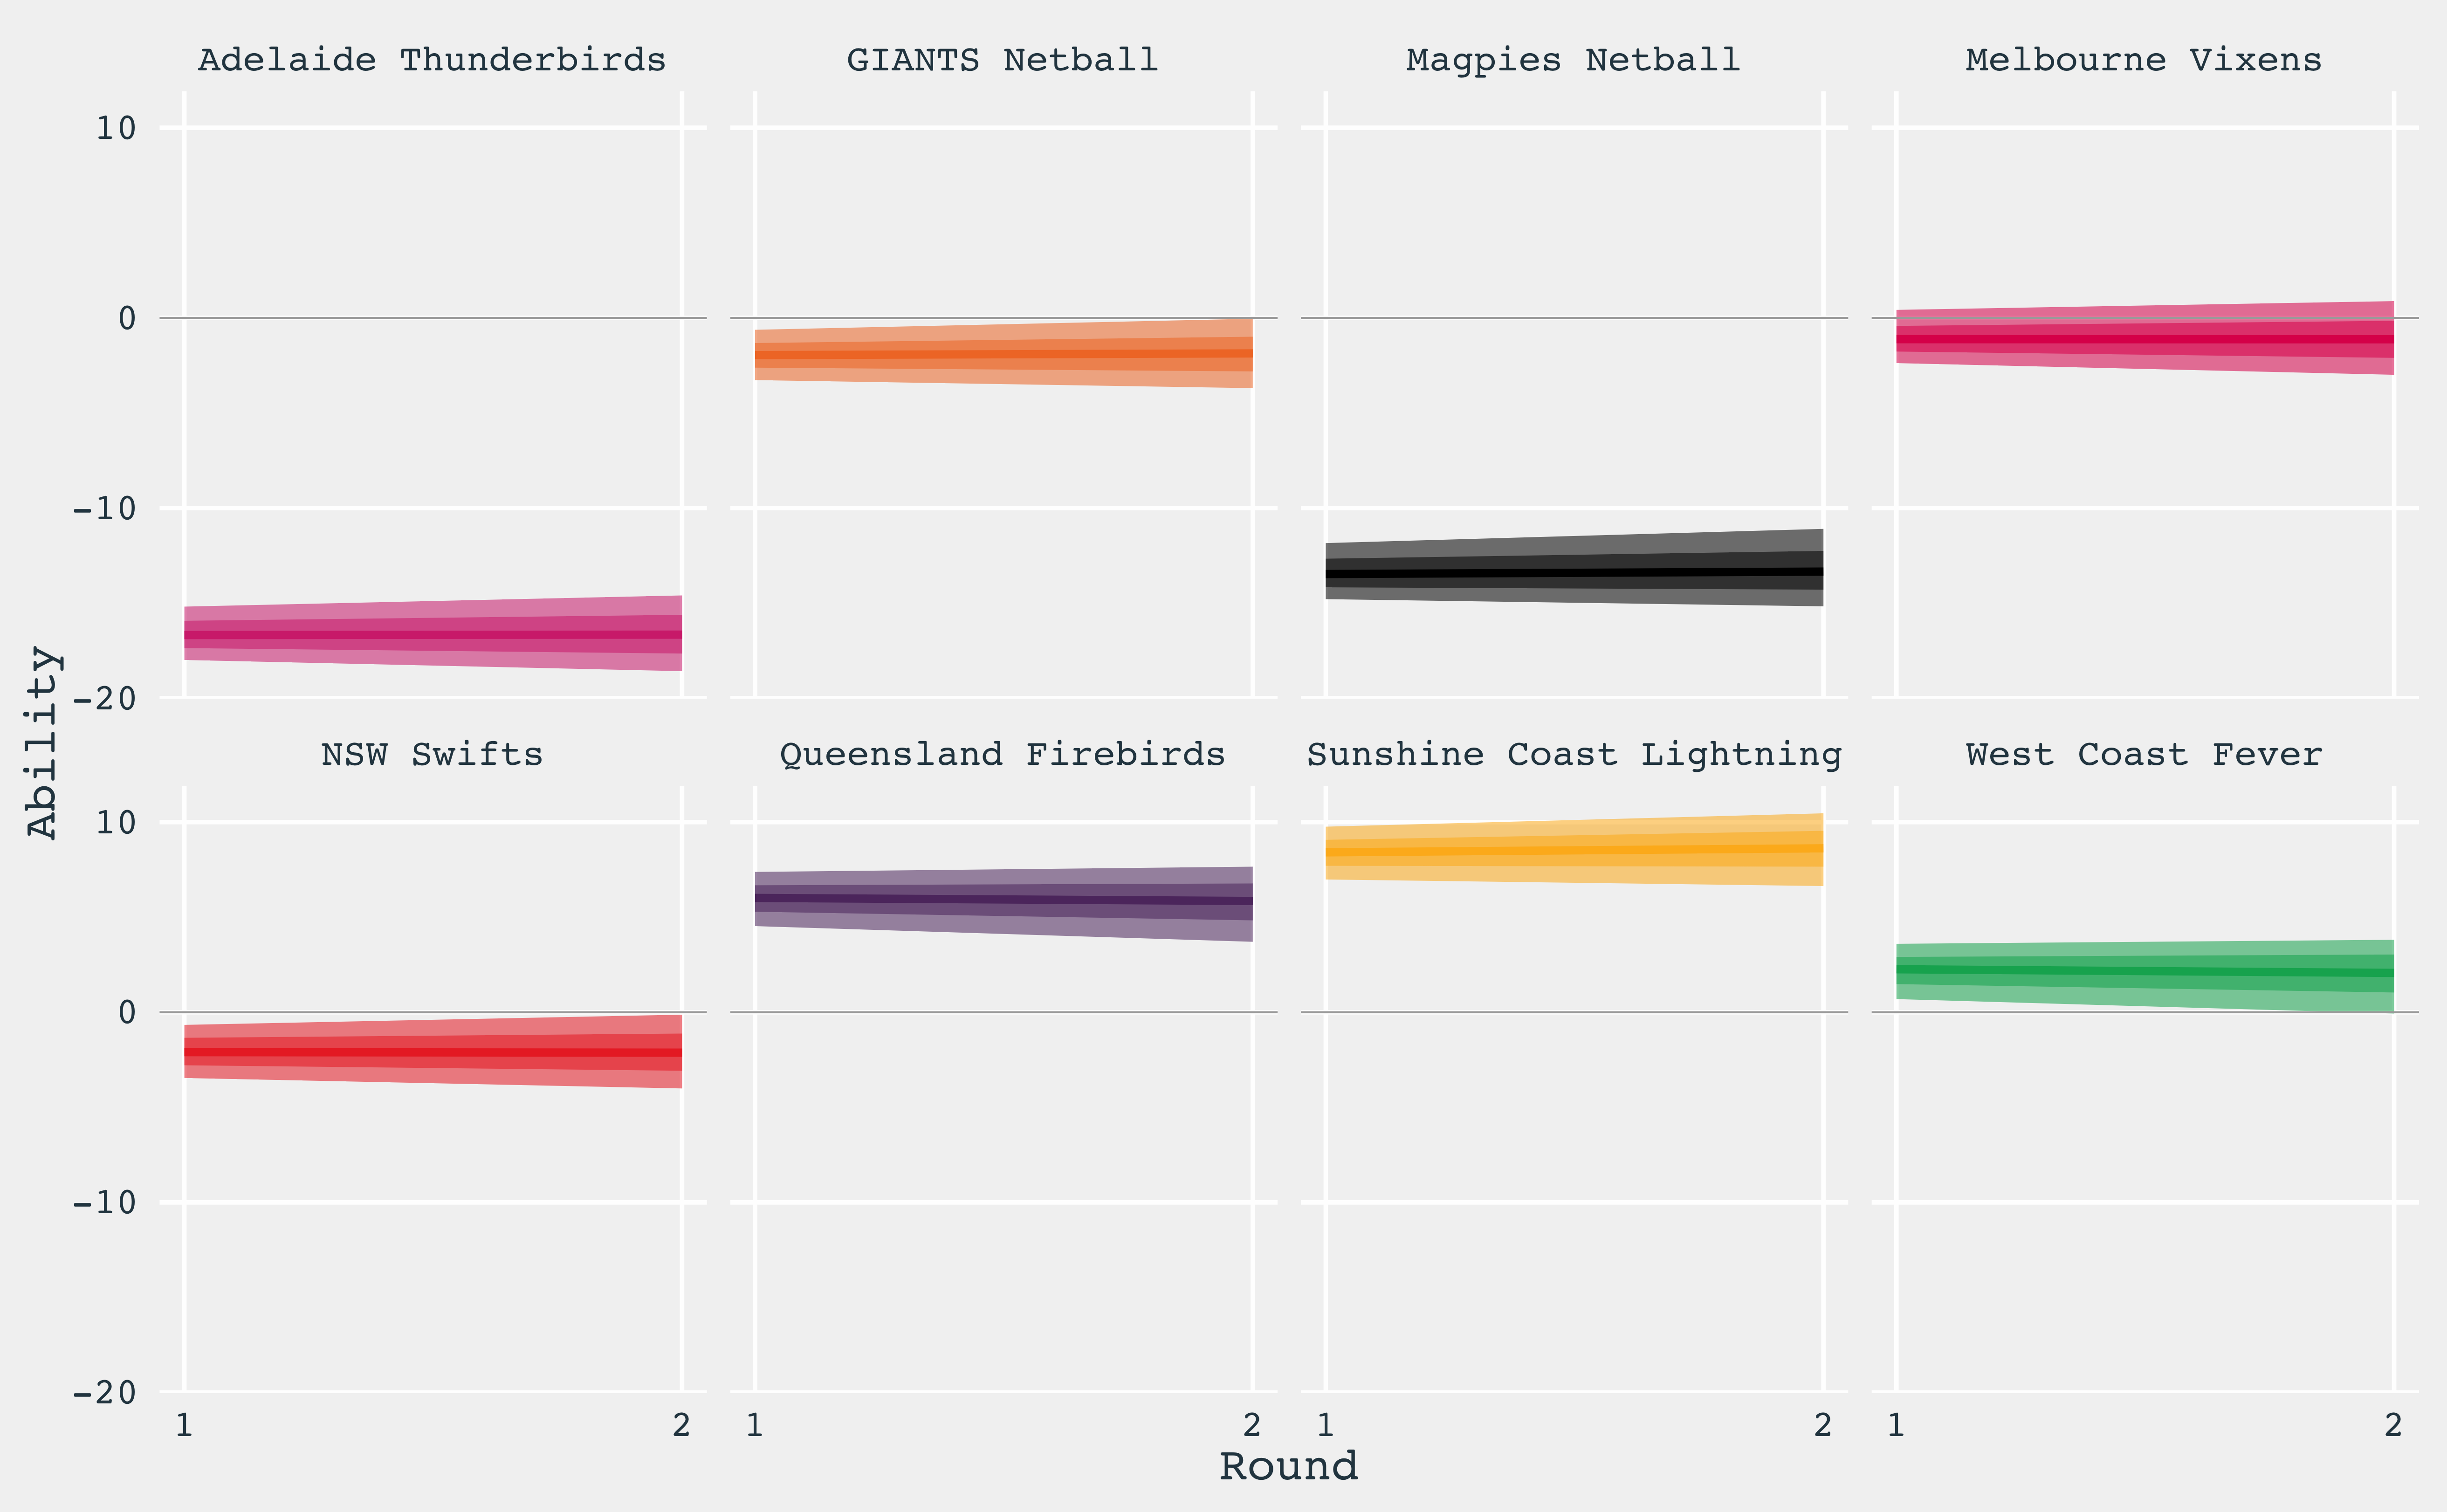
So these abilities really don’t pass the initial sniff test I don’t think. I would have thought they’d have moved more, but they’ve barely moved at all! Nothing in the model has changed though, so that’s a little bit of a saving grace. My investigations show that the home ground advantage parameter is really wacky, so maybe this is drowning out any ability signal we might see.
I’m not going to check on this one any further at the moment. Given I haven’t changed the model, I may just let it run its course for a couple more weeks.