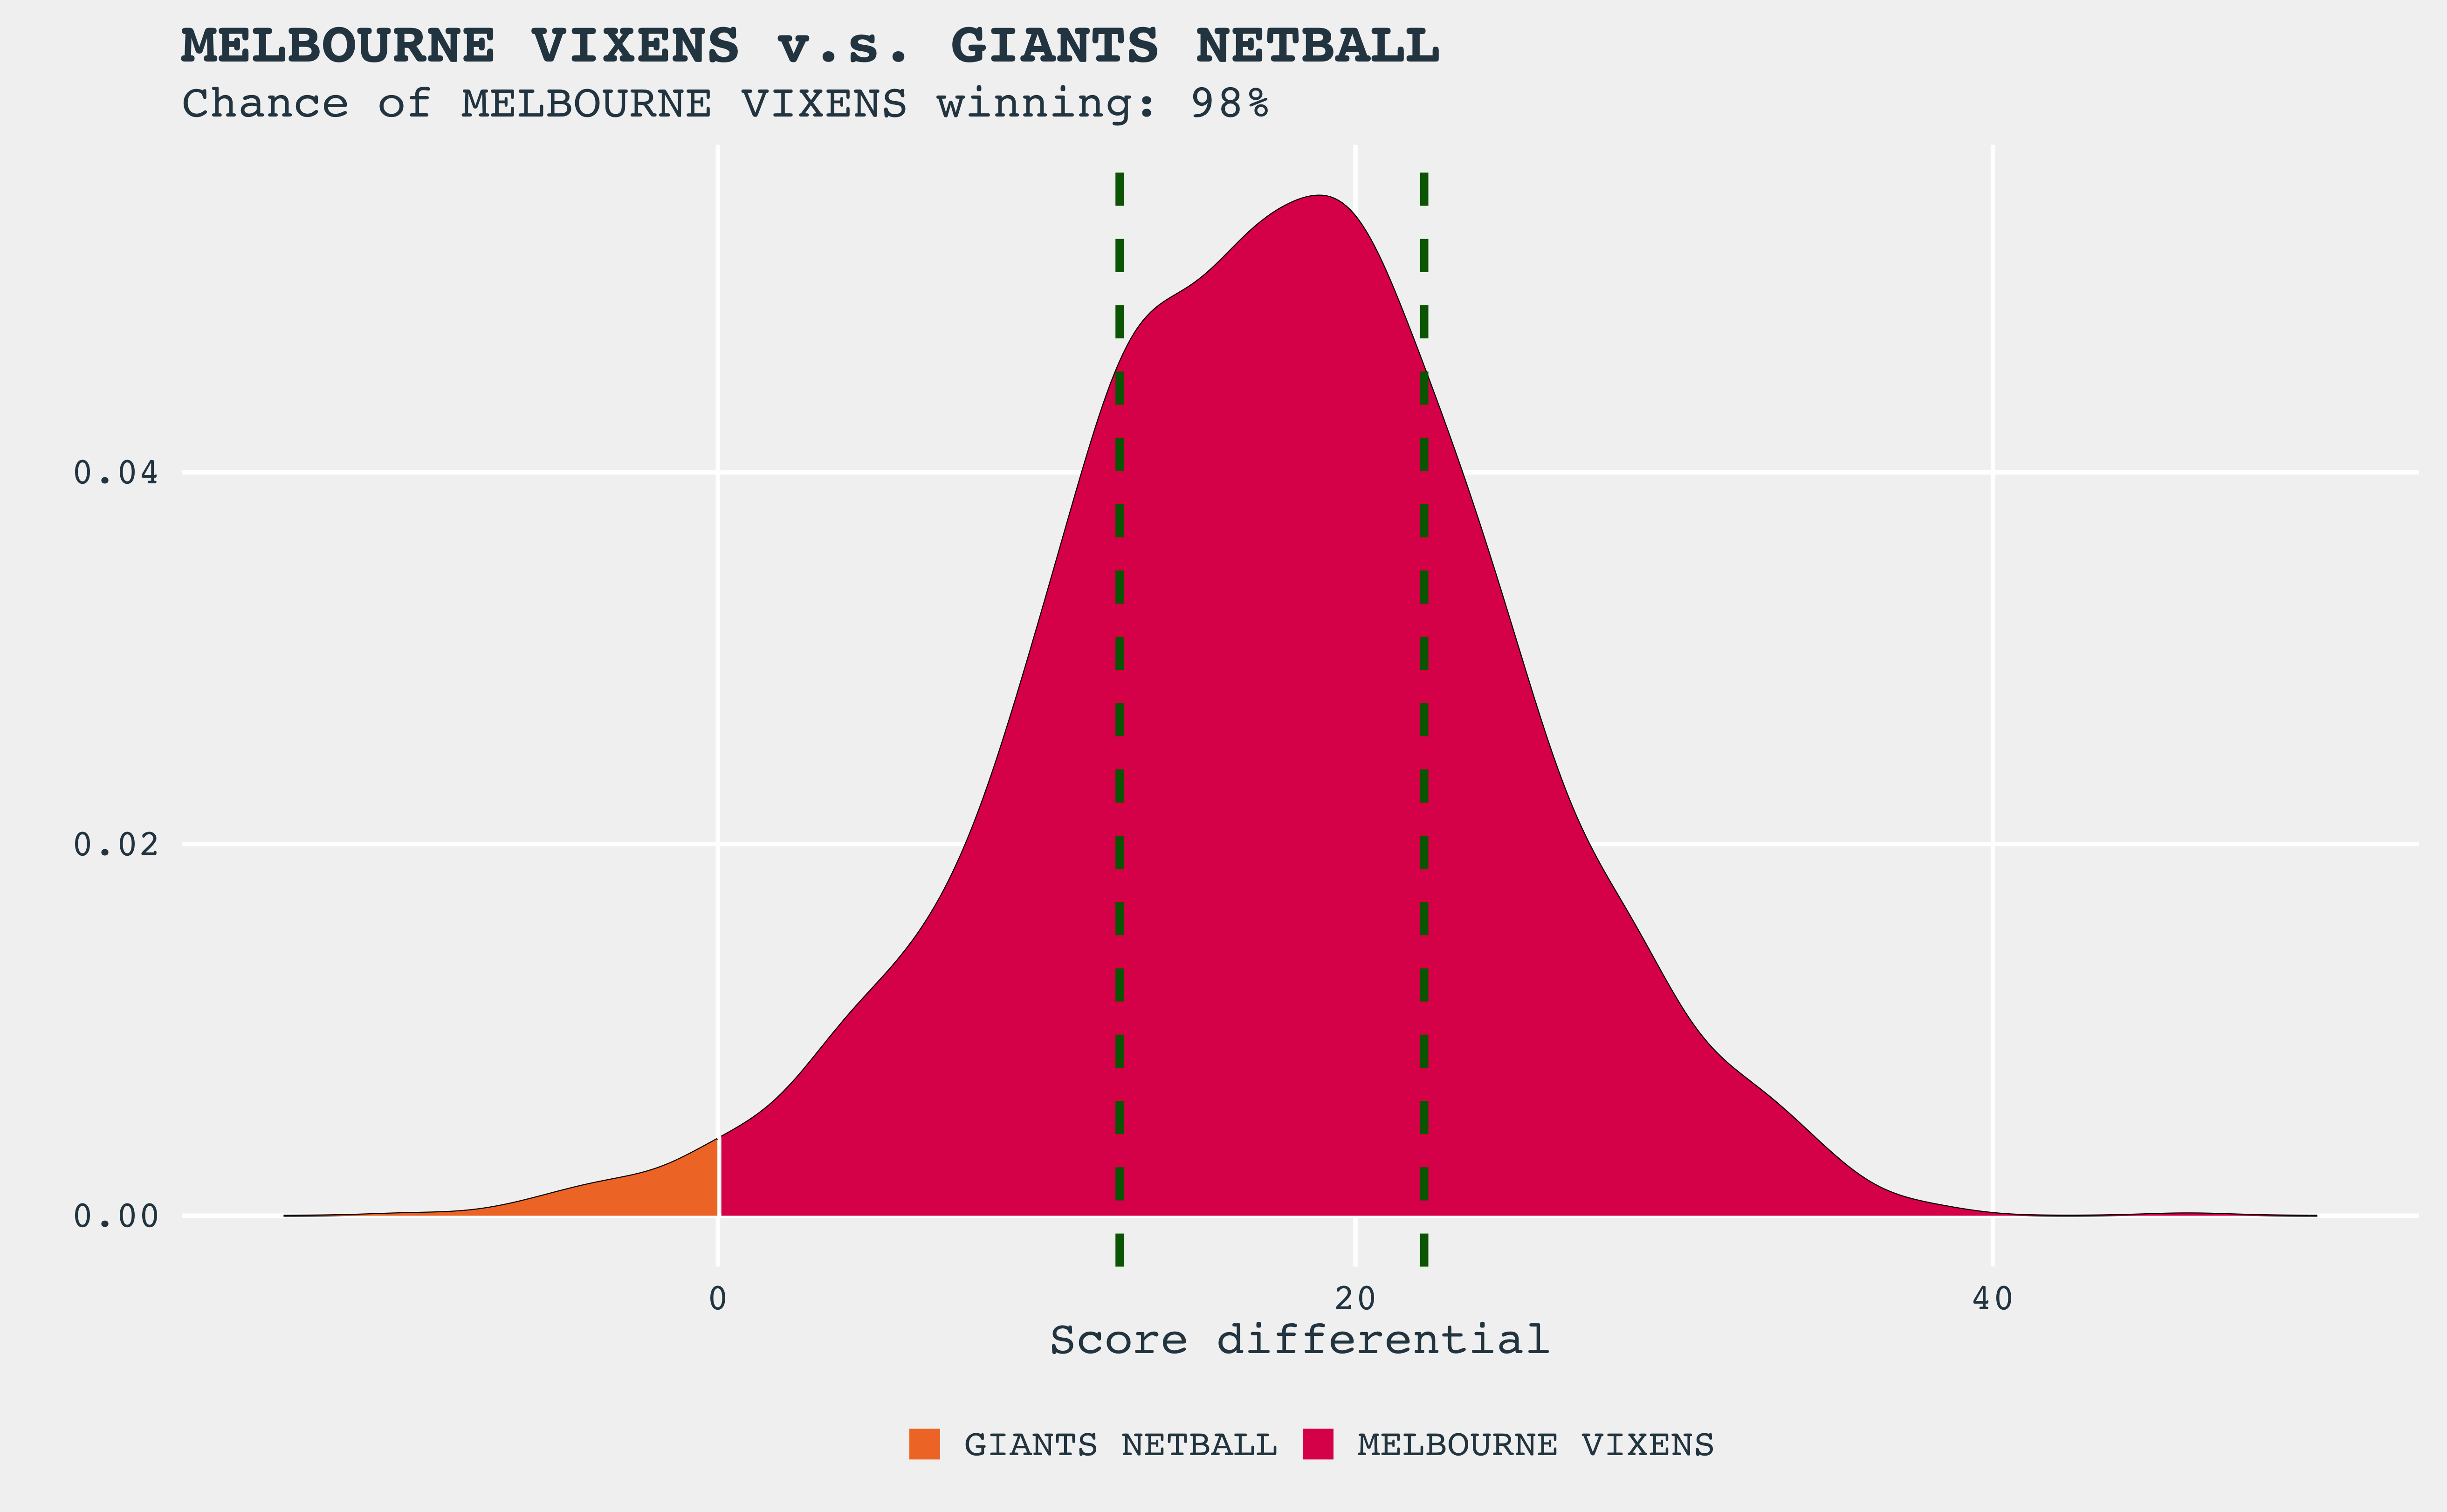
Predictions for round 2 are given in the table below. We’re now into using the results from round 1, so hopefully we’ll start getting closer to calibration. I think that another few weeks of results will be required at a minimum though. In particular, the Vixens prediction against the Giants seems really crazy; and looking at past history with the Giants, I’m sure it will be much closer.
| Home | Away | Chance of home team winning |
|---|---|---|
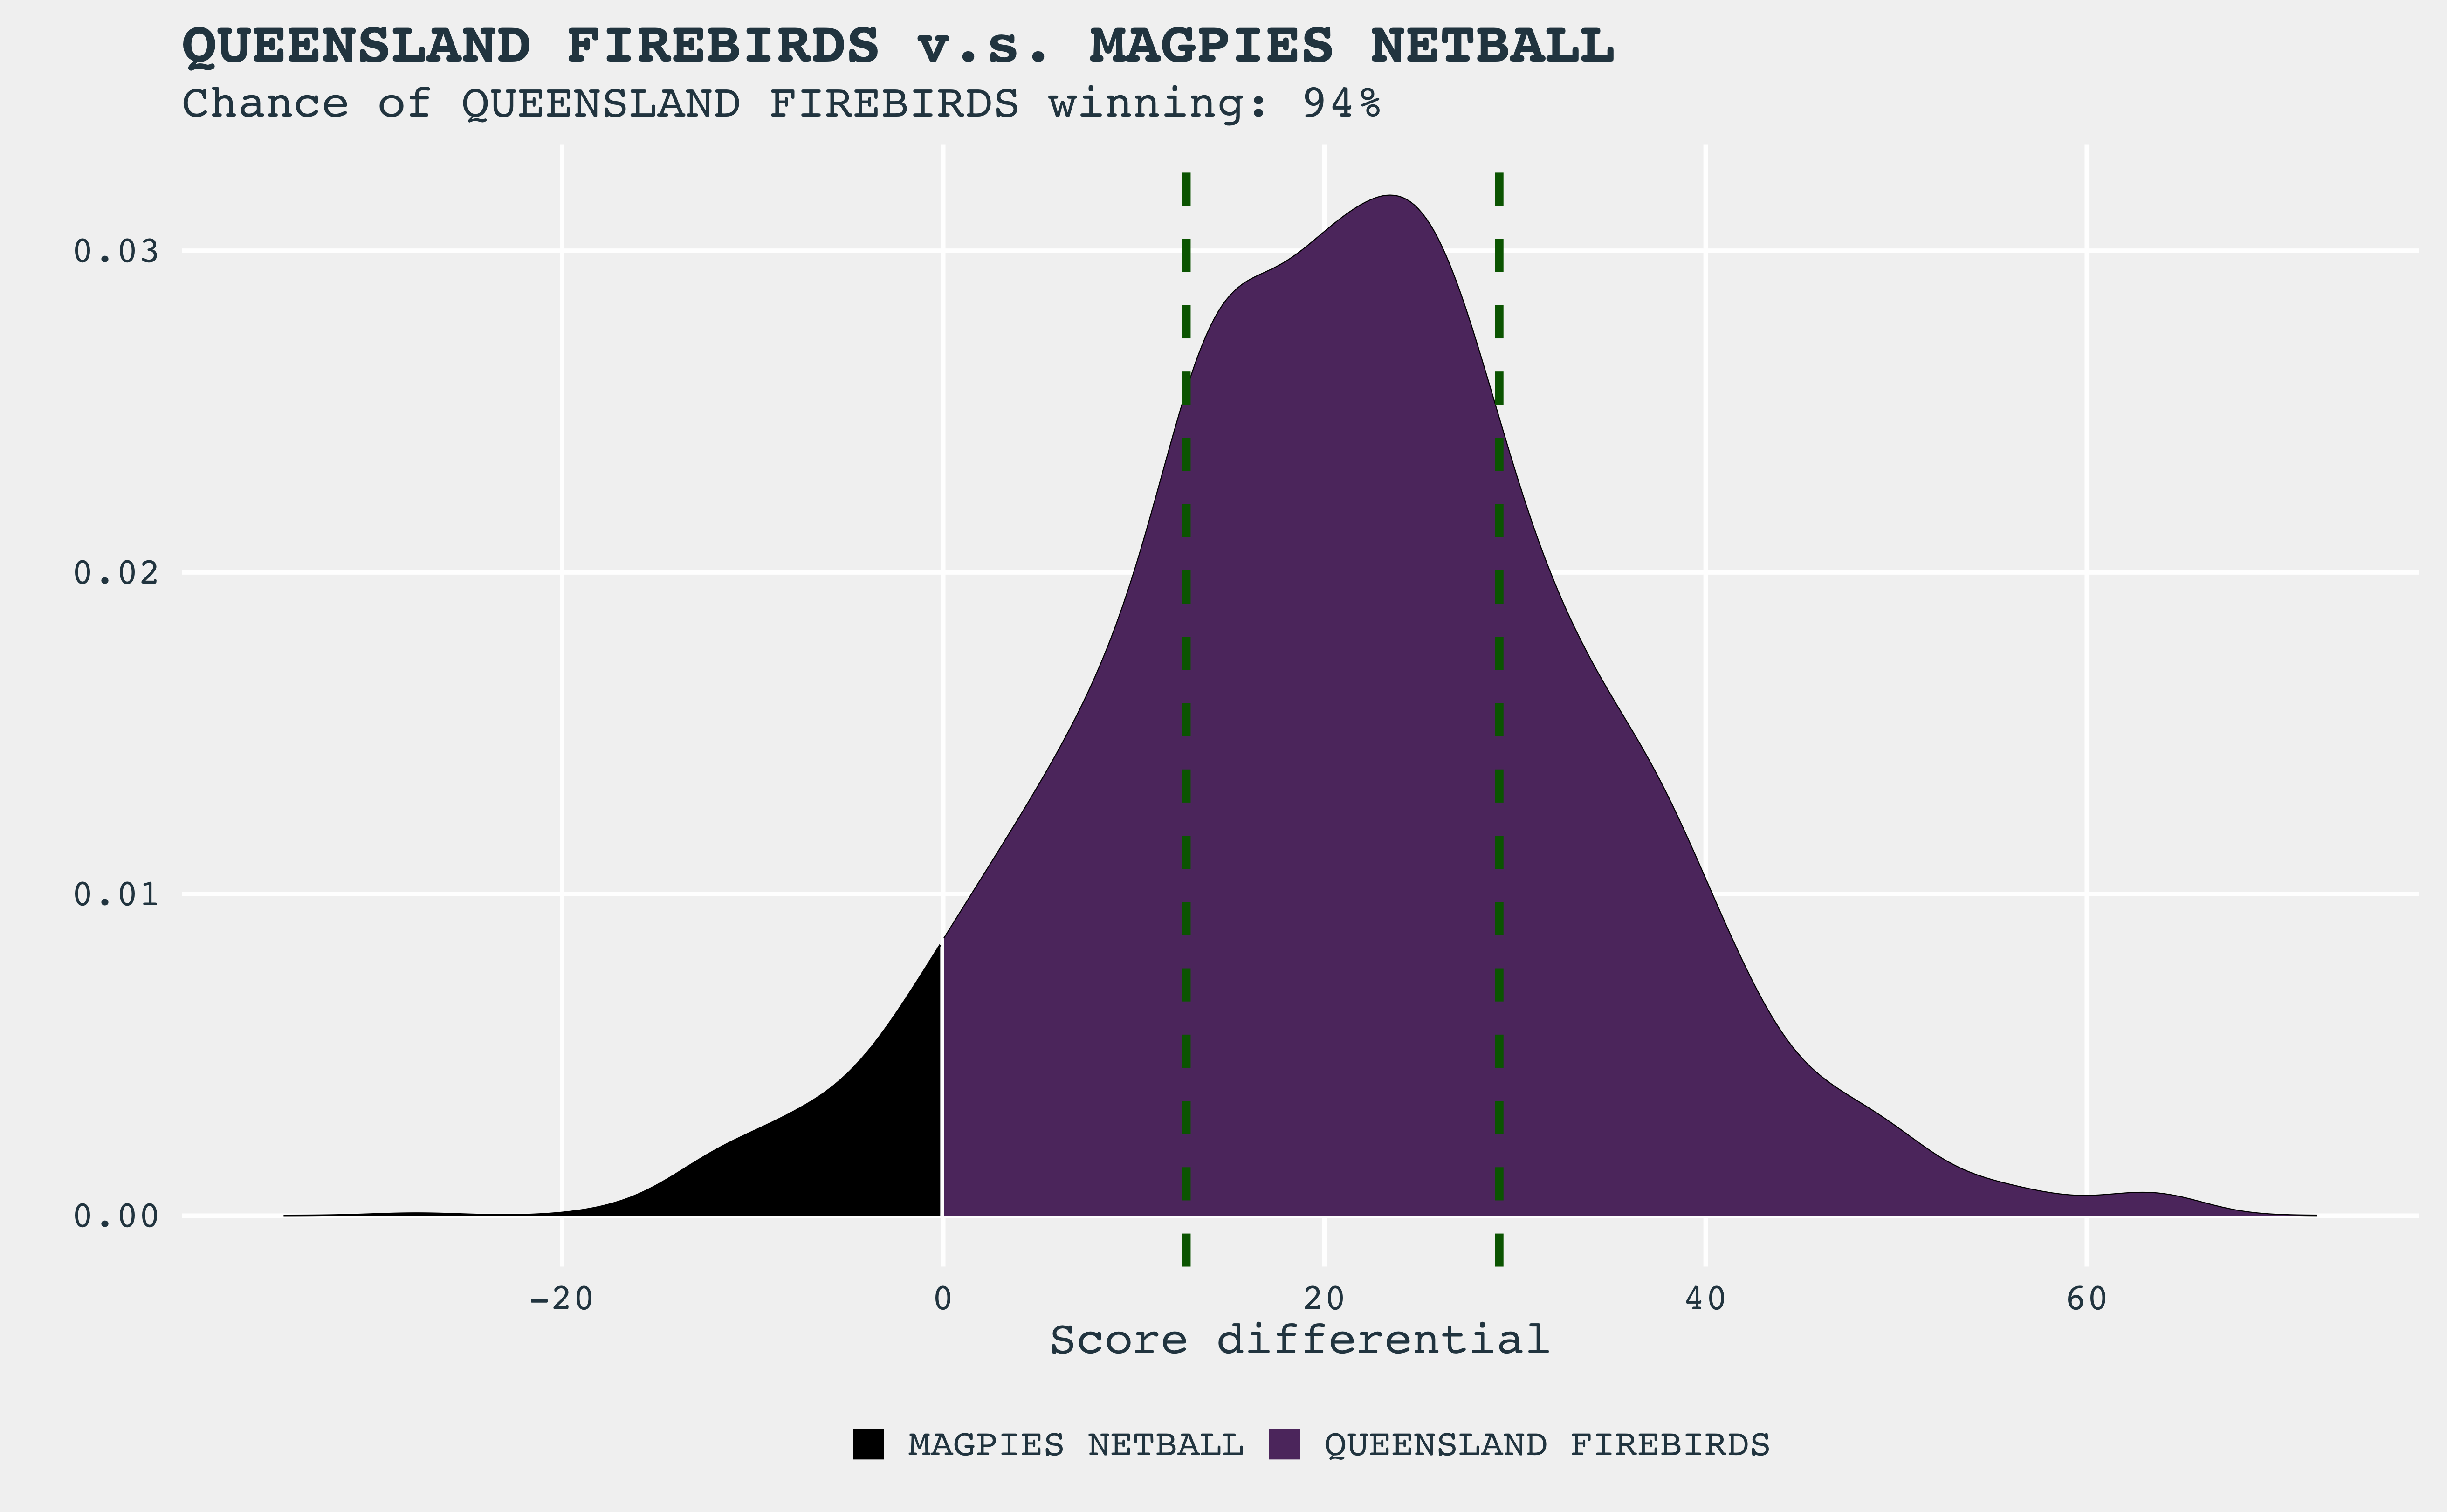
| Queensland Firebirds | Magpies Netball | 94% |
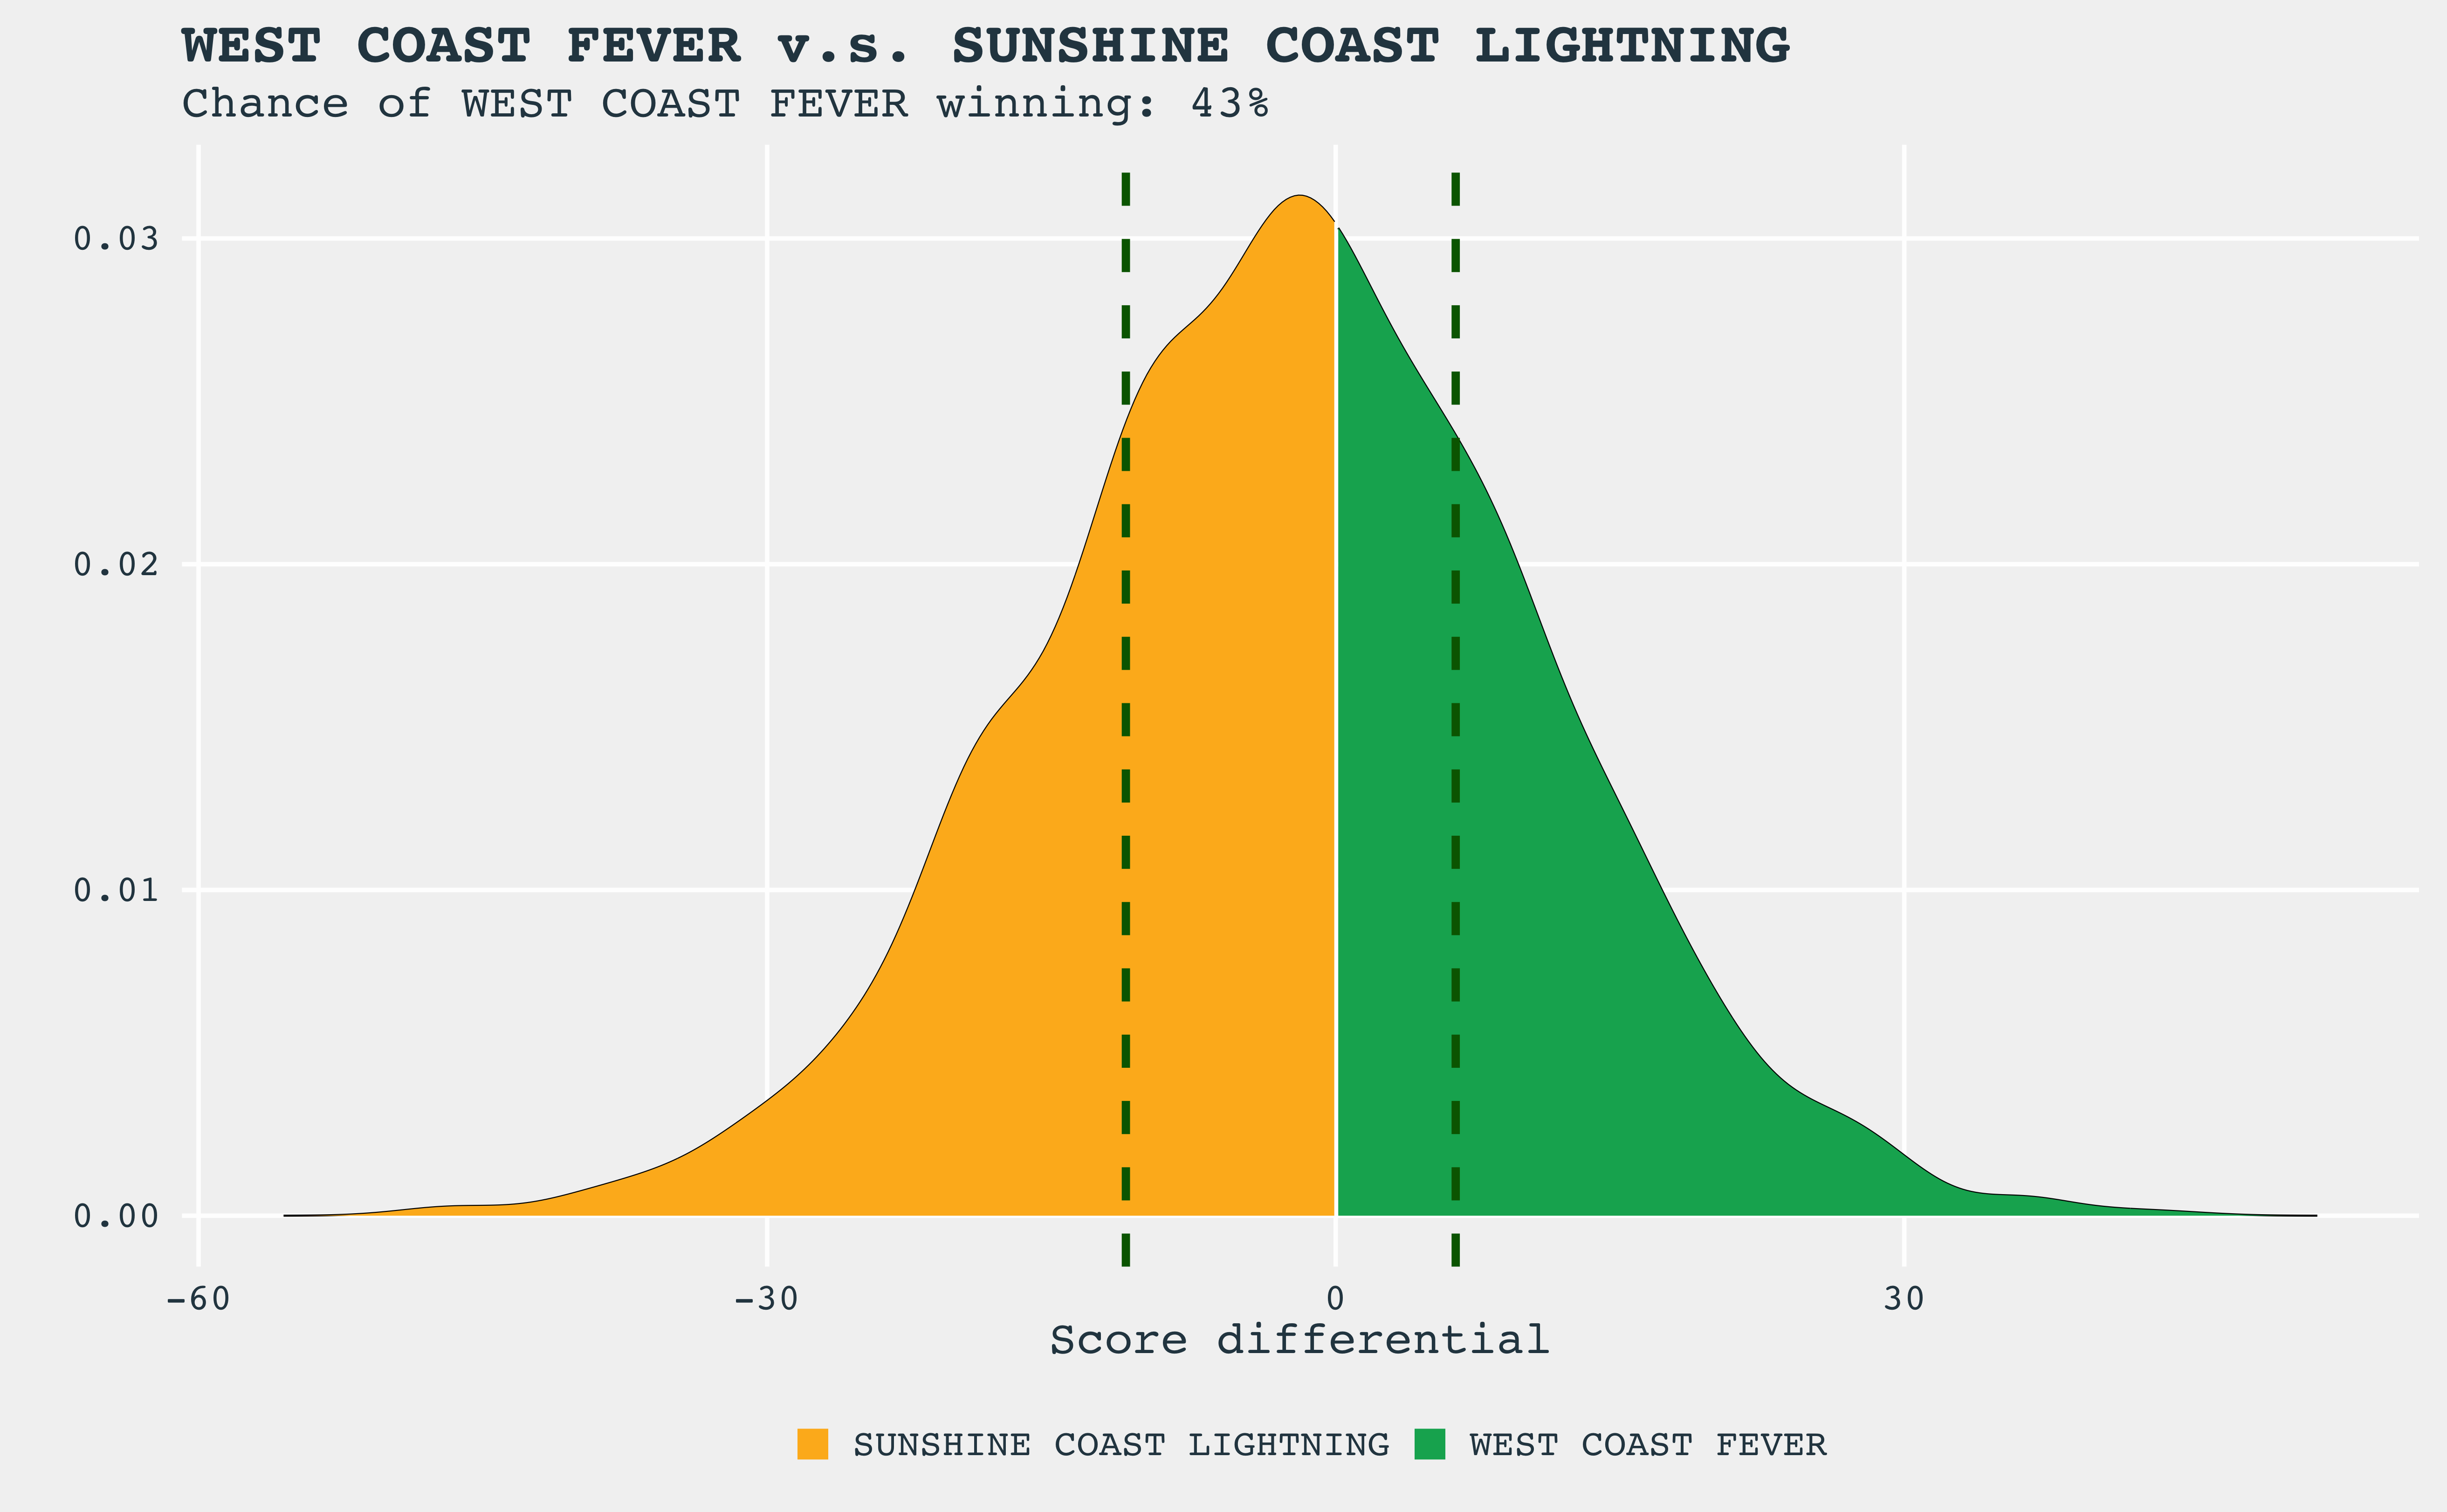
| West Coast Fever | Sunshine Coast Lightning | 43% |
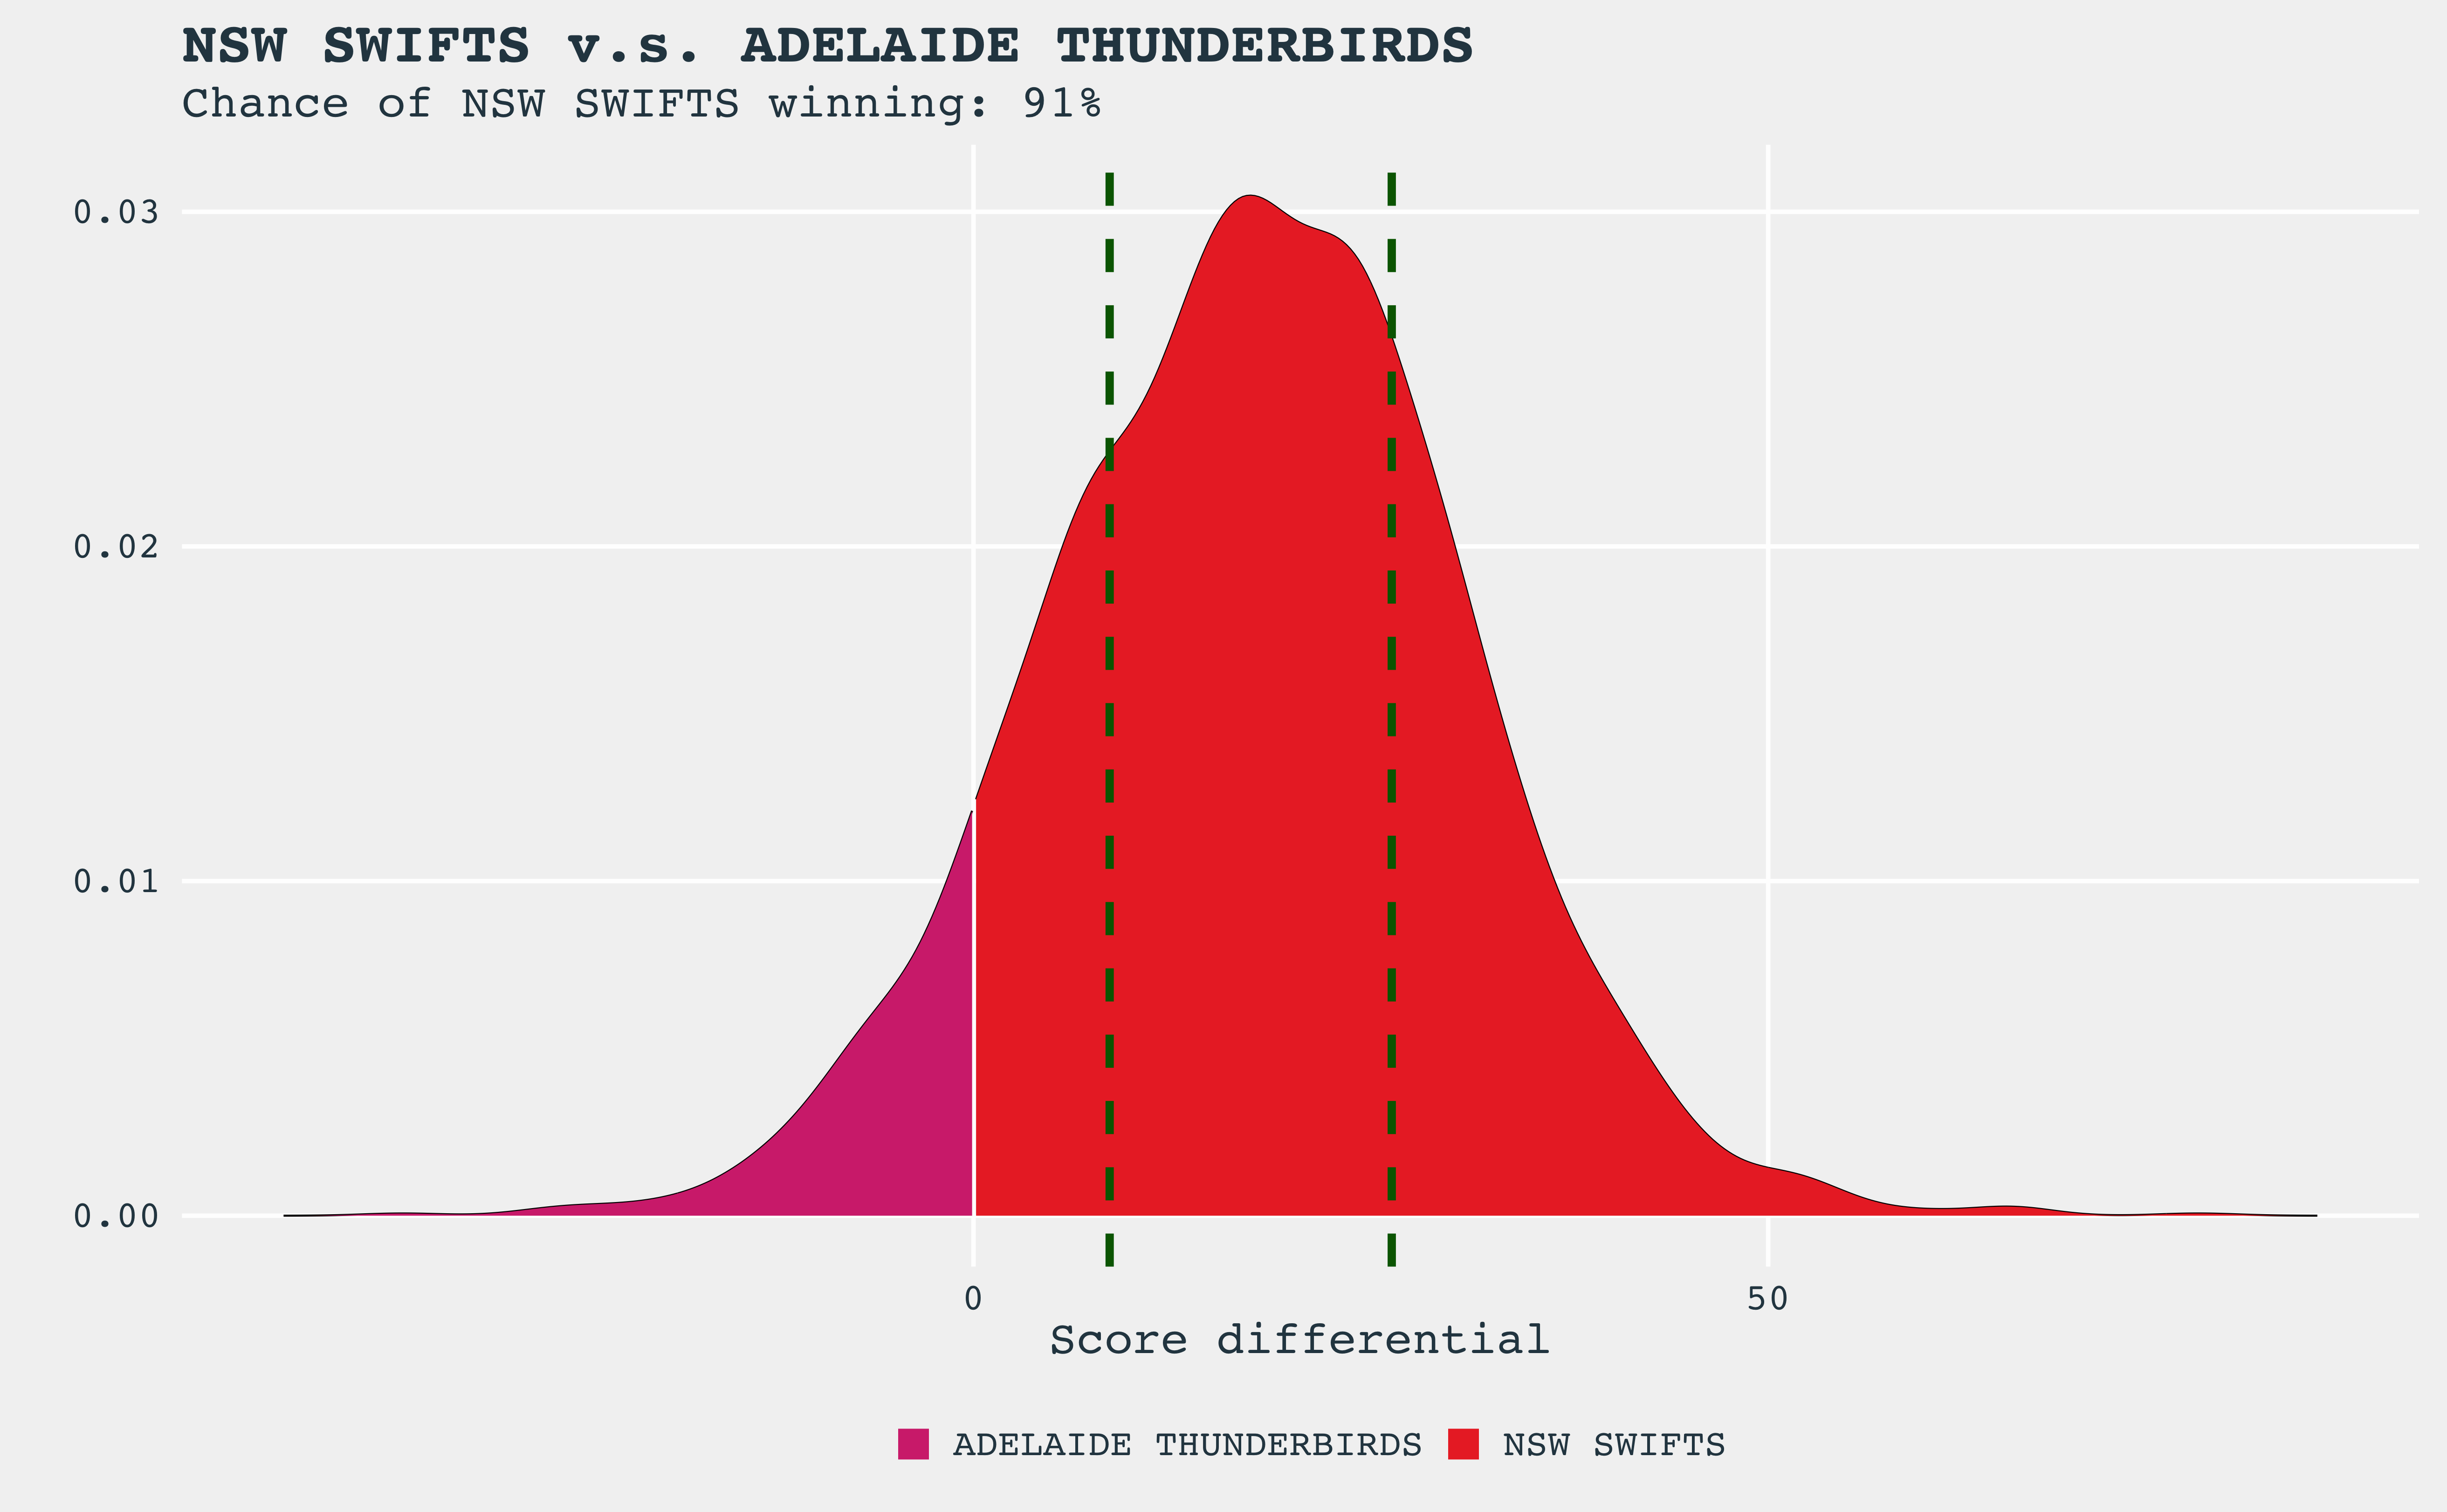
| NSW Swifts | Adelaide Thunderbirds | 91% |
| Melbourne Vixens | GIANTS Netball | 98% |
Once we get a few more rounds in, I’ll start looking a bit more at how the model is tracking team abilities, and what its impact may be on game results.
Score Differential Distributions
The distribution of the predicted score differentials is shown in the figures below. For each game, the chance of the home team winning is calculated and shown in the figure title. Each distribution is coloured by the team’s colours, and the more of a single team’s colour, the higher the chance that team has of winning. Overlaid on each figure are two vertical, dashed dark green lines; these show the score differential that has a 50% predicted chance of happening.