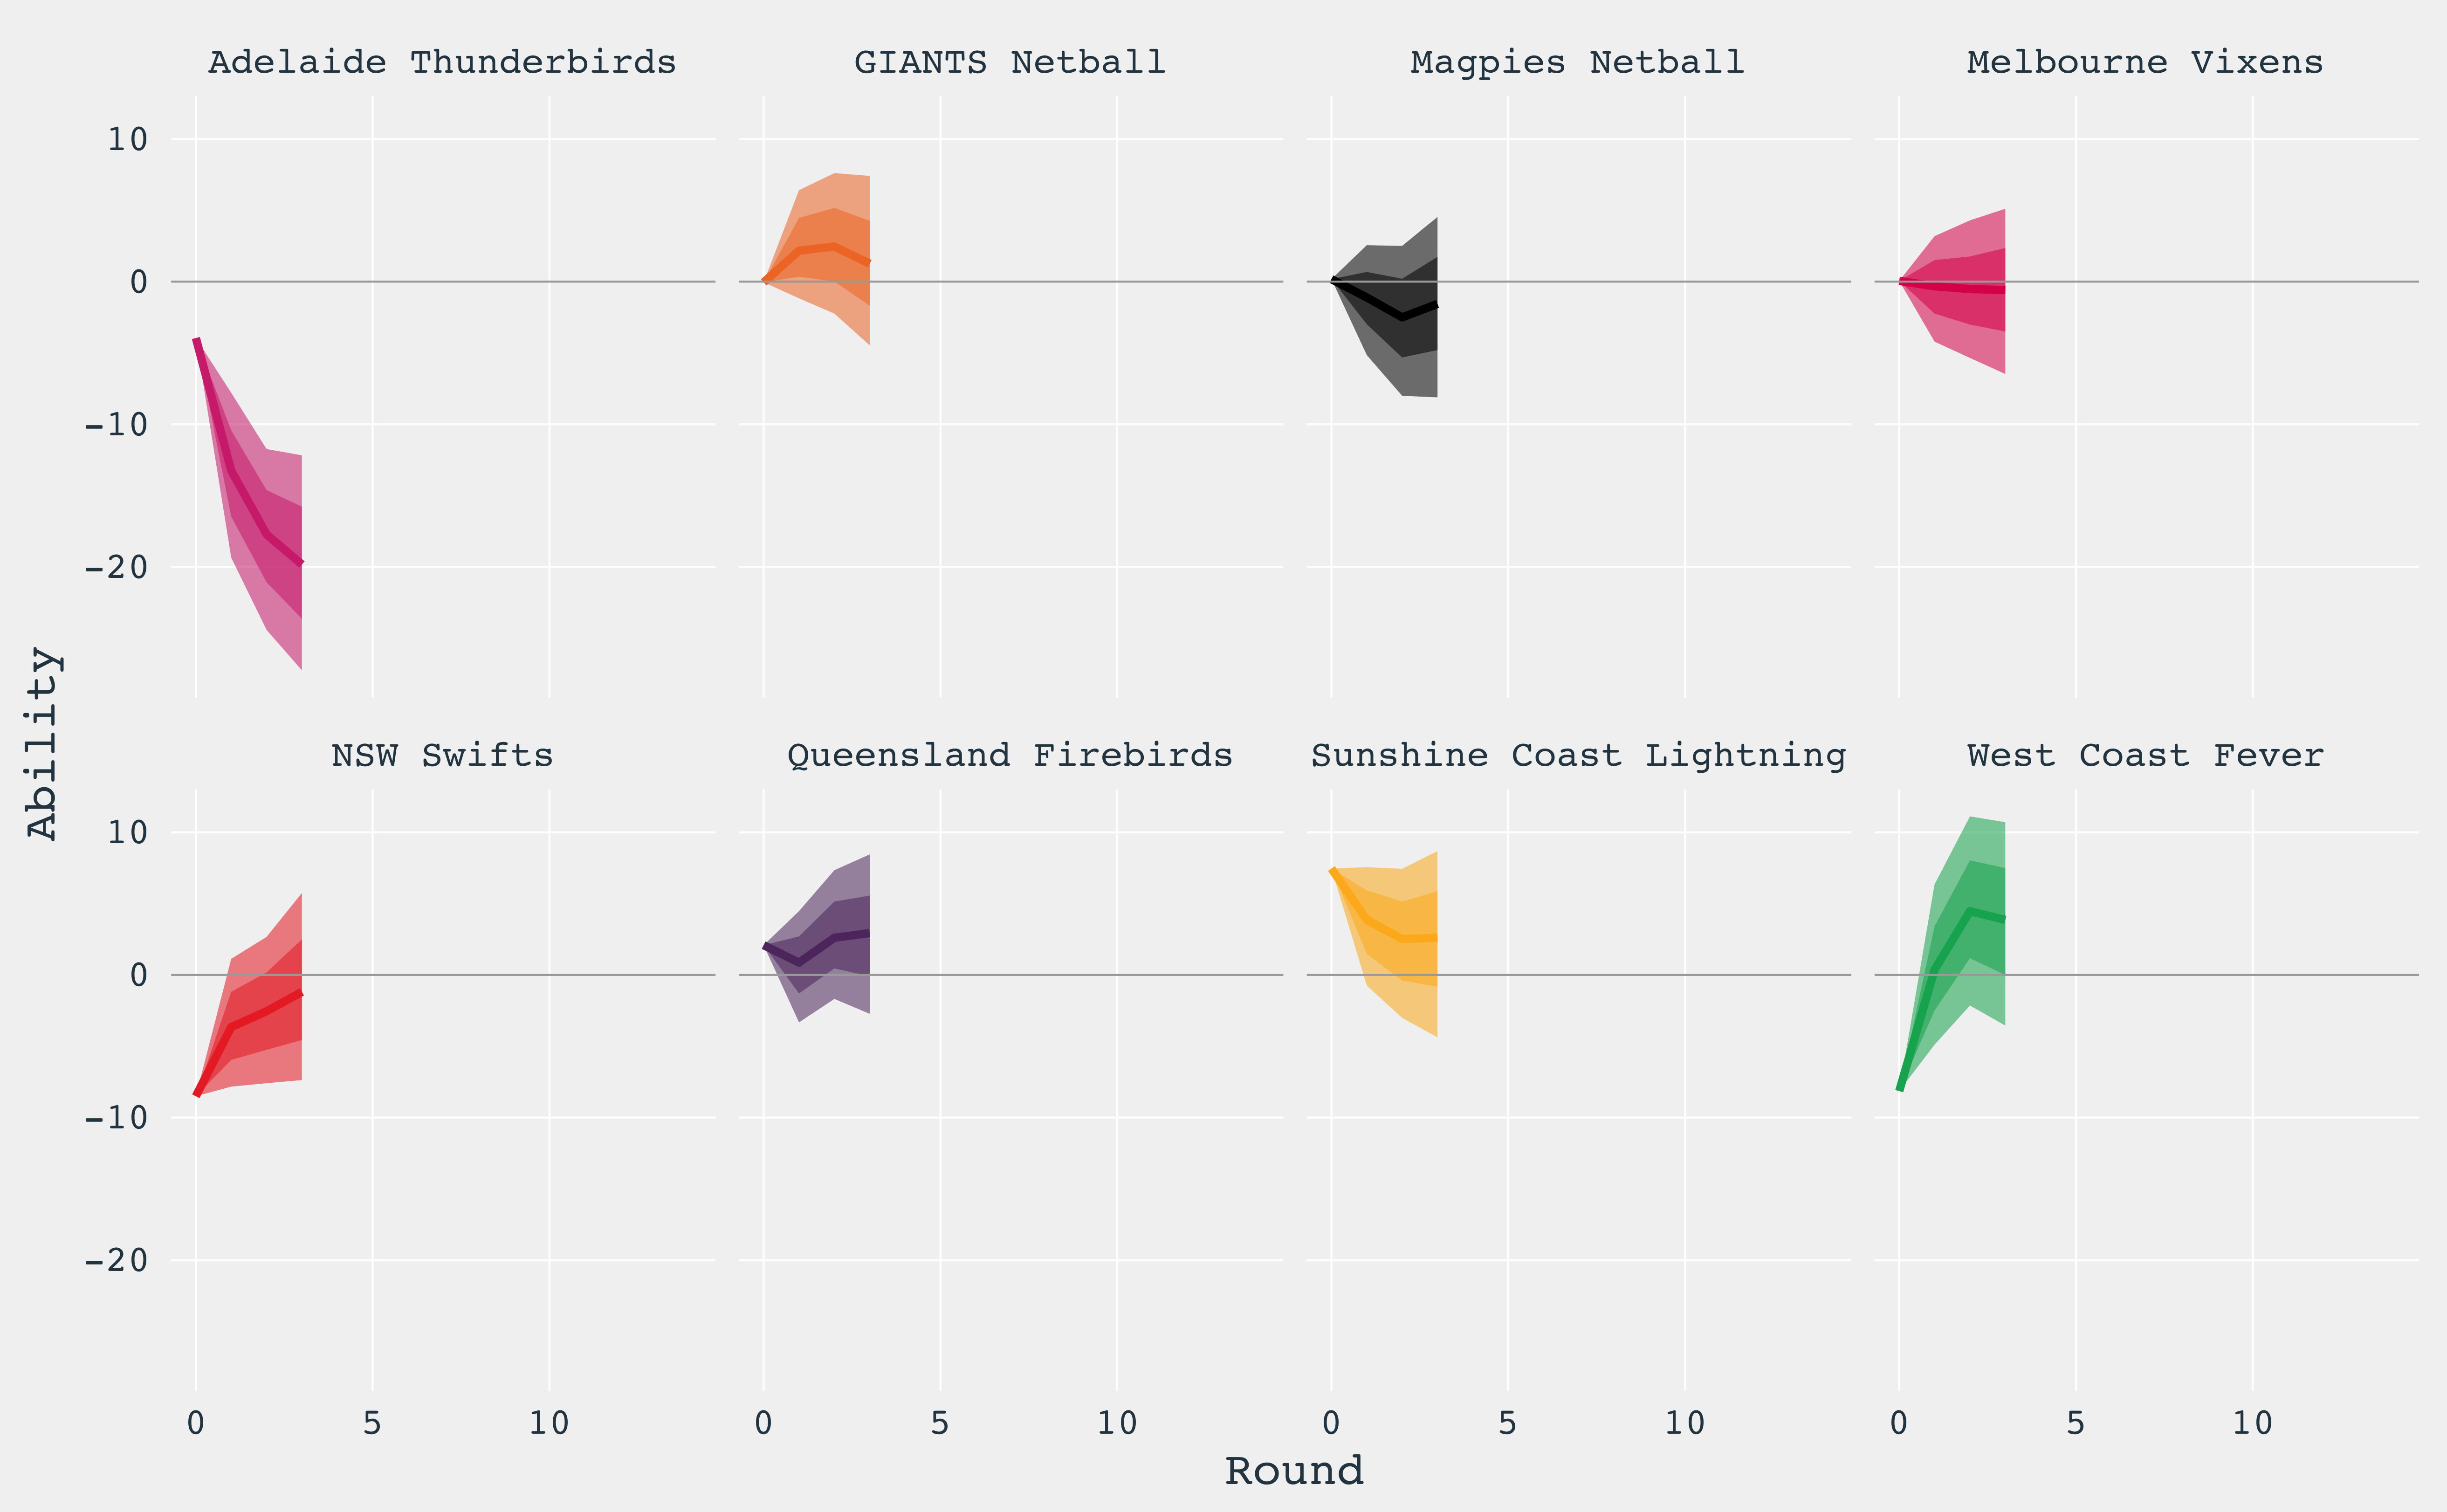
So we’re starting to see some form come in to the matches. The Lightning look they’re down and out; I can’t really see them coming back from here, especially with a tricky game against the magpies this weekend.
If you missed my round 3 predictions, here they are.
Wrap-up
| Home | Away | Chance of home team winning | Home Score | Away Score | Winner |
|---|---|---|---|---|---|
| Melbourne Vixens | Queensland Firebirds | 36% | 55 | 59 | Queensland Firebirds |
| Sunshine Coast Lightning | West Coast Fever | 44% | 55 | 56 | West Coast Fever |
| Magpies Netball | Adelaide Thunderbirds | 81% | 70 | 50 | Magpies Netball |
| NSW Swifts | GIANTS Netball | 21% | 55 | 54 | NSW Swifts |
Is the model now hitting its stride? It gave the Vixens a 36% chance of winning, and unfortunately they went down to the Firebirds, who are looking quite strong.
The Fever were very slight favourites (56%) away from home, and they got the job done against the Lightning who rely do have a premiership hangover.
The Magpies were strong favourites (80%) against the Thunderbirds, and the result was a true thrashing. 20 goals the difference, poor ol’ Thunderbirds, looks like another year of dwelling in the cellar.
The final game of the round saw the Swifts beat the Giants. The Giants were hotly fancied by the model (79%), but in a close game, the Swifts got the job done.
Team Abilities
Now that there’s a few rounds down, let’s check out how the model views the team ability:

These abilities essentially correspond to the score difference that the team would experience. So for example, we see the Vixens ability after three rounds around zero, whilst the Thunderbirds ability is around -20. For the next round where the Thunderbirds play the Vixens at home, we’d expect a score difference around -20, i.e. the Thunderbirds to lose by around 20 goals. If you have a look at the predicted score difference distribution in the round 4 predictions, you’ll see that is indeed the case.
Check out the round 4 predictions here.